## Diagram: Consensus Building Process
### Overview
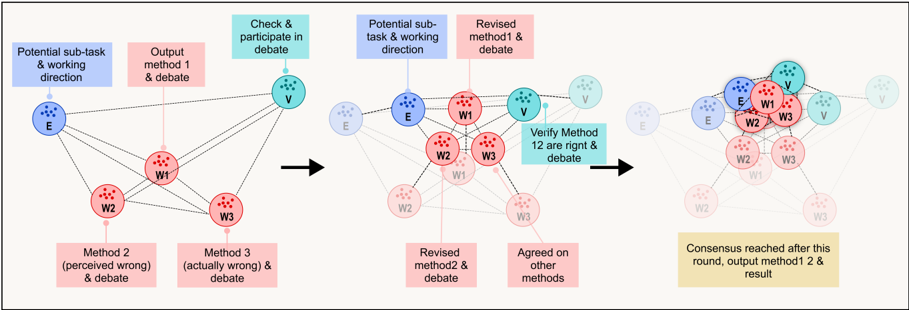
The image depicts a diagram illustrating a consensus-building process through iterative debate and method revision. The diagram is divided into three stages, showing the evolution of ideas and methods towards a final consensus. Each stage involves potential sub-tasks, method outputs, checks, and revisions, represented by nodes and connecting lines.
### Components/Axes
* **Nodes:** Represent different aspects of the process, such as potential sub-tasks, output methods, checks, and revisions.
* Blue Nodes: Represent potential sub-tasks and working directions or verification steps.
* Red Nodes: Represent output methods and debates.
* Yellow Node: Represents the final consensus.
* **Edges (Dashed Lines):** Connect the nodes, indicating relationships and dependencies between them.
* **Arrows:** Indicate the flow of the process from one stage to the next.
* **Labels:** Textual descriptions associated with each node, clarifying its role in the process.
### Detailed Analysis
**Stage 1 (Left):**
* **Blue Node (Top-Left):** Labeled "Potential sub-task & working direction" and contains a cluster of approximately 8 smaller blue dots. Node is labeled "E".
* **Red Node (Top-Center):** Labeled "Output method 1 & debate" and contains a cluster of approximately 8 smaller red dots. Node is labeled "W1".
* **Red Node (Bottom-Left):** Labeled "Method 2 (perceived wrong) & debate" and contains a cluster of approximately 8 smaller red dots. Node is labeled "W2".
* **Red Node (Bottom-Right):** Labeled "Method 3 (actually wrong) & debate" and contains a cluster of approximately 8 smaller red dots. Node is labeled "W3".
* **Teal Node (Top-Right):** Labeled "Check & participate in debate" and contains a cluster of approximately 8 smaller teal dots. Node is labeled "V".
* Dashed lines connect "E" to "W1", "W2", and "W3". Dashed lines also connect "W1", "W2", and "W3" to each other. "V" is connected to "W1", "W2", and "W3" via dashed lines.
**Stage 2 (Center):**
* An arrow points from Stage 1 to Stage 2, indicating the progression of the process.
* The nodes from Stage 1 are present but faded in the background.
* **Blue Node (Top-Left):** Labeled "Potential sub-task & working direction" and contains a cluster of approximately 8 smaller blue dots. Node is labeled "E".
* **Red Node (Top-Center):** Labeled "Revised method1 & debate" and contains a cluster of approximately 8 smaller red dots. Node is labeled "W1".
* **Red Node (Bottom-Left):** Labeled "Revised method2 & debate" and contains a cluster of approximately 8 smaller red dots. Node is labeled "W2".
* **Red Node (Bottom-Right):** Labeled "Agreed on other methods" and contains a cluster of approximately 8 smaller red dots. Node is labeled "W3".
* **Teal Node (Top-Right):** Labeled "Verify Method 12 are rignt & debate" and contains a cluster of approximately 8 smaller teal dots. Node is labeled "V".
* Dashed lines connect "E" to "W1", "W2", and "W3". Dashed lines also connect "W1", "W2", and "W3" to each other. "V" is connected to "W1", "W2", and "W3" via dashed lines.
**Stage 3 (Right):**
* An arrow points from Stage 2 to Stage 3, indicating the progression of the process.
* The nodes from Stage 2 are present but faded in the background.
* The blue, red, and teal nodes are clustered together at the top of the stage.
* **Yellow Node (Bottom):** Labeled "Consensus reached after this round, output method1 2 & result".
### Key Observations
* The diagram illustrates an iterative process of refining methods through debate and verification.
* The initial stage involves identifying potential sub-tasks and debating different methods.
* Subsequent stages involve revising methods based on feedback and verification.
* The process culminates in a consensus, where a final output method and result are agreed upon.
### Interpretation
The diagram demonstrates a structured approach to problem-solving and decision-making. It highlights the importance of considering multiple perspectives, engaging in constructive debate, and iteratively refining methods to achieve a consensus. The process emphasizes the value of identifying and addressing potential issues with methods, leading to a more robust and reliable outcome. The clustering of nodes in the final stage suggests a convergence of ideas and a shared understanding among participants. The diagram could be used to explain a collaborative research process, a product development cycle, or any scenario where consensus-building is essential.