## Diagram: Neural Architecture Search Controller Loop
### Overview
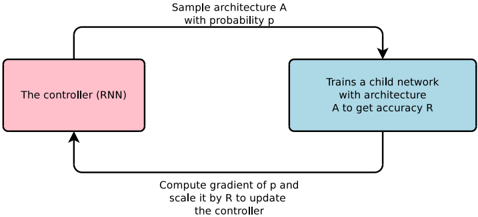
The image displays a flowchart illustrating a cyclic process for neural architecture search, where a controller recurrent neural network (RNN) iteratively proposes and evaluates child network architectures. The diagram depicts a closed-loop system of sampling, training, evaluation, and controller update.
### Components/Axes
The diagram consists of two primary rectangular nodes connected by two directional arrows, forming a cycle.
1. **Left Node (Pink Rectangle):**
* **Label:** "The controller (RNN)"
* **Position:** Left side of the diagram.
* **Function:** Represents the master network that generates architecture proposals.
2. **Right Node (Blue Rectangle):**
* **Label:** "Trains a child network with architecture A to get accuracy R"
* **Position:** Right side of the diagram.
* **Function:** Represents the process of instantiating, training, and evaluating a candidate neural network.
3. **Top Arrow (Flow from Left to Right):**
* **Label:** "Sample architecture A with probability p"
* **Direction:** From the top of the Controller node to the top of the Training node.
* **Function:** The controller outputs a probability distribution over possible architectures and samples a specific architecture `A` from it.
4. **Bottom Arrow (Flow from Right to Left):**
* **Label:** "Compute gradient of p and scale it by R to update the controller"
* **Direction:** From the bottom of the Training node back to the bottom of the Controller node.
* **Function:** The performance metric (accuracy `R`) of the child network is used as a reward signal to compute a policy gradient, which updates the controller's parameters to make it more likely to sample high-performing architectures in the future.
### Detailed Analysis
The diagram outlines a reinforcement learning loop applied to architecture search:
* **Step 1 (Sampling):** The Controller RNN, acting as a policy network, outputs a probability `p` for a candidate architecture `A` and samples one.
* **Step 2 (Evaluation):** The sampled architecture `A` is instantiated as a child neural network, trained on a task, and evaluated to produce a scalar accuracy score `R`.
* **Step 3 (Update):** The reward `R` is used to scale the gradient of the log-probability `p` of the chosen action (sampling `A`). This gradient update reinforces the controller's parameters for actions that led to high accuracy.
### Key Observations
* The process is explicitly cyclic and iterative, implying this loop runs many times.
* The controller is an RNN, suggesting it maintains some internal state or can generate sequential architecture descriptions.
* The update rule ("scale it by R") is characteristic of the REINFORCE policy gradient algorithm, a common method in reinforcement learning.
* The diagram uses color coding: pink for the controller component and blue for the training/evaluation component.
### Interpretation
This diagram succinctly captures the core mechanism of early neural architecture search (NAS) methods like the one proposed in "Neural Architecture Search with Reinforcement Learning" (Zoph & Le, 2017). It demonstrates how a meta-learning problem (finding a good architecture) can be framed as a reinforcement learning problem. The controller learns a policy over a vast space of possible architectures, using the child network's validation accuracy as a reward signal to improve its sampling strategy over time. The "probability p" is the key learnable parameter; the system's goal is to shape this probability distribution so that it concentrates on high-performing architectures. The absence of specific numerical values indicates this is a conceptual schematic of the algorithm's flow, not a report of experimental results.