## Chart Type: Scatter Plot
### Overview
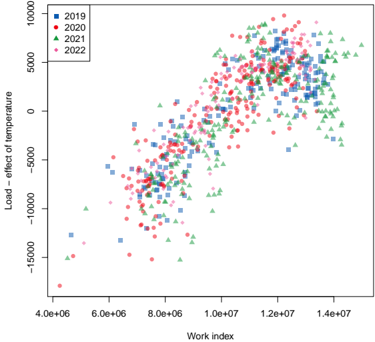
This scatter plot shows the relationship between "Work index" and "Load - effect of temperature" for the years 2019, 2020, 2021, and 2022. Each year is represented by a different color and marker shape.
### Components/Axes
* **X-axis:** Work index (ranging from approximately 4.0e+06 to 1.4e+07)
* **Y-axis:** Load - effect of temperature (ranging from -15000 to 10000)
* **Legend (top-left):**
* Blue squares: 2019
* Red circles: 2020
* Green triangles: 2021
* Pink circles: 2022
### Detailed Analysis
* **2019 (Blue Squares):** The data points generally show an upward trend from a Work index of 6.0e+06 to 1.4e+07, with the Load effect of temperature increasing from -15000 to approximately 5000. There is a cluster of points around Work index 1.4e+07 and Load effect of temperature 0.
* **2020 (Red Circles):** Similar to 2019, the data points show an upward trend from a Work index of 4.0e+06 to 1.2e+07, with the Load effect of temperature increasing from -17000 to approximately 7000.
* **2021 (Green Triangles):** The data points also show an upward trend, but with more scatter. The Work index ranges from 7.0e+06 to 1.4e+07, and the Load effect of temperature ranges from -15000 to 7000.
* **2022 (Pink Circles):** The data points are concentrated in the lower Work index range, from 4.0e+06 to 1.0e+07. The Load effect of temperature ranges from -15000 to 5000.
### Key Observations
* All years show a general positive correlation between Work index and Load - effect of temperature.
* The data for 2022 is concentrated at lower Work index values compared to the other years.
* There is considerable overlap between the data points for different years, especially in the middle range of Work index values.
* The spread of data points is wider for 2021 compared to the other years.
### Interpretation
The scatter plot suggests that as the Work index increases, the Load - effect of temperature also tends to increase. This relationship is observed across all four years, although the distribution and range of data points vary. The concentration of 2022 data at lower Work index values could indicate a change in the system or process being measured during that year. The wider spread of data points for 2021 may indicate greater variability or instability in the system during that year. The overlap between the years suggests that the relationship between Work index and Load - effect of temperature is relatively consistent over time, but with some year-to-year variations.