## Scatter Plot: Music Genre Distribution Across Valid and Test Sets
### Overview
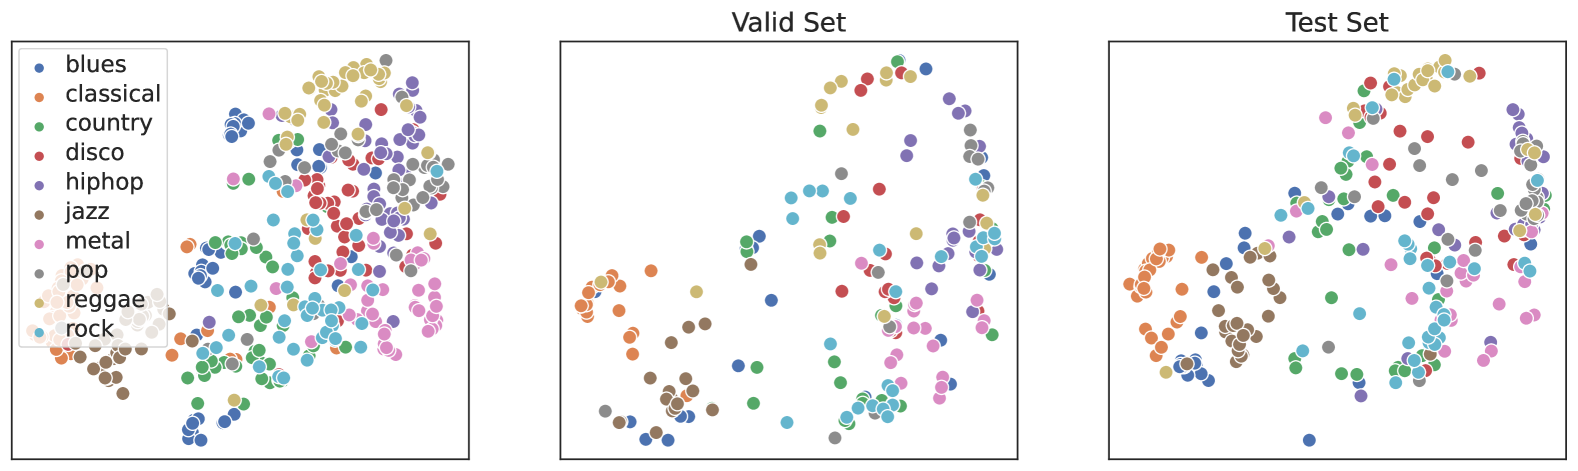
The image displays three scatter plots comparing music genre distributions across datasets. Each plot uses colored dots to represent genres (e.g., blues, classical, hip-hop) with spatial clustering patterns. The legend maps 10 genres to distinct colors. The Valid Set and Test Set panels show distinct clustering behaviors, while the combined chart aggregates all data points.
### Components/Axes
- **Legend**:
- **Colors**:
- Blues: Blue
- Classical: Orange
- Country: Green
- Disco: Red
- Hip-hop: Purple
- Jazz: Brown
- Metal: Pink
- Pop: Gray
- Reggae: Yellow
- Rock: Light Blue
- **Panels**:
1. **Left Panel**: Labeled "Valid Set"
2. **Center Panel**: Labeled "Test Set"
3. **Right Panel**: Labeled "Valid + Test Set" (combined data)
- **Axes**: No explicit axis labels or scales are visible. Spatial positioning is relative (e.g., "bottom-left," "top-right").
### Detailed Analysis
#### Valid Set (Left Panel)
- **Blues (Blue)**: Clustered in the bottom-left quadrant, with moderate density.
- **Classical (Orange)**: Dominates the top-left quadrant, forming a dense cluster.
- **Country (Green)**: Scattered across the mid-left region, overlapping with blues.
- **Disco (Red)**: Sparse, isolated points in the mid-right quadrant.
- **Hip-hop (Purple)**: Concentrated in the top-right quadrant, overlapping with pop (gray).
- **Jazz (Brown)**: Clustered in the bottom-center, overlapping with classical.
- **Metal (Pink)**: Scattered in the mid-right, with low density.
- **Pop (Gray)**: Spread across the top-right, overlapping with hip-hop.
- **Reggae (Yellow)**: Sparse, isolated points in the bottom-right.
- **Rock (Light Blue)**: Clustered in the mid-right, overlapping with disco.
#### Test Set (Center Panel)
- **Blues (Blue)**: Concentrated in the bottom-left, denser than in the Valid Set.
- **Classical (Orange)**: Dominates the top-left, slightly more dispersed than in the Valid Set.
- **Country (Green)**: Scattered in the mid-left, less overlap with blues.
- **Disco (Red)**: Sparse, isolated points in the mid-right, similar to Valid Set.
- **Hip-hop (Purple)**: Clustered in the top-right, overlapping with pop.
- **Jazz (Brown)**: Clustered in the bottom-center, overlapping with classical.
- **Metal (Pink)**: Scattered in the mid-right, similar to Valid Set.
- **Pop (Gray)**: Spread across the top-right, overlapping with hip-hop.
- **Reggae (Yellow)**: Sparse, isolated points in the bottom-right.
- **Rock (Light Blue)**: Clustered in the mid-right, overlapping with disco.
#### Combined Chart (Right Panel)
- Aggregates all data points from Valid and Test Sets.
- **Blues (Blue)**: Spread across the bottom-left, with higher density than individual panels.
- **Classical (Orange)**: Dominates the top-left, forming the largest cluster.
- **Country (Green)**: Scattered mid-left, with reduced overlap with blues.
- **Disco (Red)**: Sparse mid-right points.
- **Hip-hop (Purple)**: Top-right cluster, overlapping with pop.
- **Jazz (Brown)**: Bottom-center cluster, overlapping with classical.
- **Metal (Pink)**: Mid-right scattered points.
- **Pop (Gray)**: Top-right spread, overlapping with hip-hop.
- **Reggae (Yellow)**: Sparse bottom-right points.
- **Rock (Light Blue)**: Mid-right cluster, overlapping with disco.
### Key Observations
1. **Classical (Orange)** consistently forms the largest, most cohesive cluster across all panels, suggesting it is the most prevalent or distinct genre.
2. **Blues (Blue)** and **Jazz (Brown)** show strong spatial overlap in the bottom-left and bottom-center regions, indicating shared features or similarities.
3. **Hip-hop (Purple)** and **Pop (Gray)** exhibit significant overlap in the top-right quadrant, suggesting similar characteristics.
4. **Reggae (Yellow)** and **Disco (Red)** are the least dense, with isolated points, indicating rarity or distinctiveness.
5. The Test Set shows slightly more dispersed clusters for blues and classical compared to the Valid Set, hinting at potential data drift or sampling differences.
### Interpretation
The spatial clustering patterns suggest that genres like classical, blues, and jazz share acoustic or structural features, while hip-hop and pop overlap due to rhythmic similarities. The Test Set’s slightly dispersed clusters may reflect a more diverse or representative sample. Outliers like reggae and disco highlight niche genres with limited data points. This visualization could inform machine learning model training by identifying genre boundaries and potential overlaps, which might affect classification accuracy. The absence of axis labels limits quantitative analysis, but the relative positioning provides qualitative insights into genre relationships.