## Bar Chart: CoC (Interweave)
### Overview
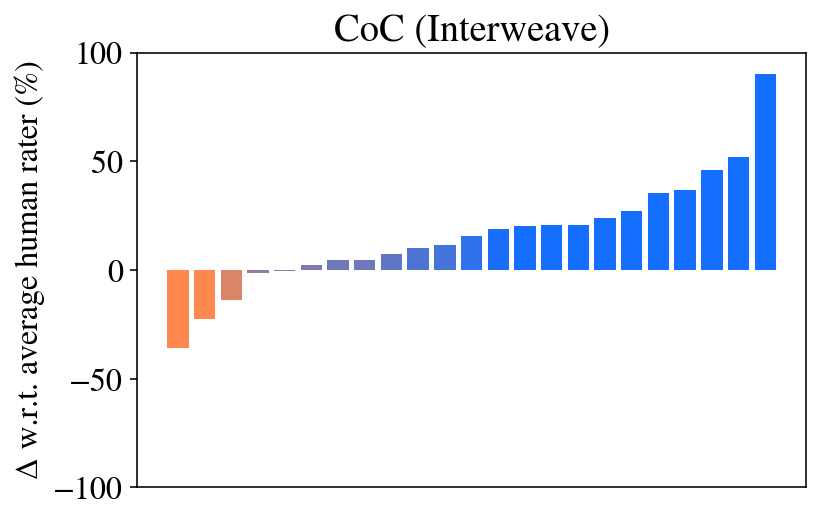
The chart visualizes the change in performance relative to an average human rater (%) for a metric labeled "CoC (Interweave)" across incremental percentage values. The y-axis represents Δ w.r.t. average human rater (%), ranging from -100% to 100%, while the x-axis categorizes data points as "CoC (Interweave)" and incremental additions (e.g., "+10%", "+20%", ..., "+100%").
### Components/Axes
- **Y-Axis**: Δ w.r.t. average human rater (%)
- Scale: -100% (bottom) to 100% (top), with gridlines at -100, -50, 0, 50, 100.
- **X-Axis**: Categories labeled as:
- "CoC (Interweave)" (leftmost)
- "CoC (Interweave) + 10%"
- "CoC (Interweave) + 20%"
- ...
- "CoC (Interweave) + 100%" (rightmost)
- **Legend**: No explicit legend, but colors are inferred:
- **Red**: Negative values (underperformance relative to human rater).
- **Gray**: Near-zero values (neutral performance).
- **Blue**: Positive values (outperformance relative to human rater).
### Detailed Analysis
- **Negative Values (Red Bars)**:
- "CoC (Interweave)": -70%
- "CoC (Interweave) + 10%": -40%
- "CoC (Interweave) + 20%": -20%
- **Neutral Value (Gray Bar)**:
- "CoC (Interweave) + 30%": ~0%
- **Positive Values (Blue Bars)**:
- "CoC (Interweave) + 40%": ~10%
- "CoC (Interweave) + 50%": ~20%
- "CoC (Interweave) + 60%": ~30%
- "CoC (Interweave) + 70%": ~40%
- "CoC (Interweave) + 80%": ~50%
- "CoC (Interweave) + 90%": ~60%
- "CoC (Interweave) + 100%": ~100%
### Key Observations
1. **Initial Underperformance**: The first three categories ("CoC (Interweave)", "+10%", "+20%") show significant negative performance (-70%, -40%, -20%), indicating a decline relative to human raters.
2. **Neutral Transition**: At "+30%", performance stabilizes near 0%, suggesting parity with human raters.
3. **Positive Correlation**: From "+40%" onward, performance improves linearly, with each 10% increment adding ~10% to the Δ value.
4. **Outlier**: The "+100%" category exhibits a sharp spike to 100%, far exceeding the incremental trend (expected ~90% based on prior pattern).
### Interpretation
The data suggests that the "CoC (Interweave)" metric initially underperforms compared to human raters but improves as the percentage increases. The linear relationship between incremental percentages and performance gains implies a scalable improvement in the metric's effectiveness. However, the abrupt jump to 100% at "+100%" deviates from the established trend, raising questions about data accuracy or a potential threshold effect. This could indicate a critical point where the metric achieves near-perfect alignment with human judgment, or it may reflect an outlier requiring further investigation. The chart underscores the importance of incremental adjustments in optimizing performance relative to human benchmarks.