## Tree Diagram: Hierarchical Structure with Color Gradient
### Overview
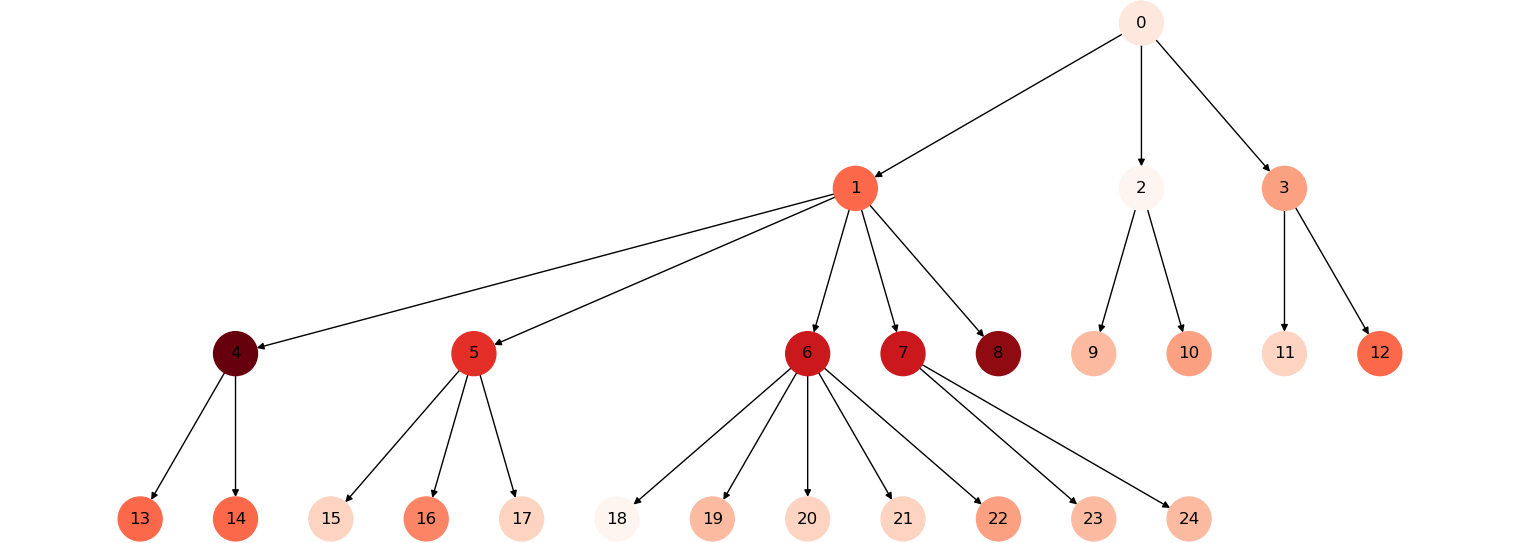
The image is a tree diagram illustrating a hierarchical structure. The nodes are represented by circles, and the connections between nodes are shown with arrows. The color of each node varies, ranging from light red to dark red, suggesting a gradient or scale associated with each node. The nodes are labeled with numbers from 0 to 24.
### Components/Axes
* **Nodes:** Represented by circles, each labeled with a unique number from 0 to 24.
* **Edges:** Represented by arrows, indicating the hierarchical relationship between nodes. The arrows point from parent nodes to child nodes.
* **Color Gradient:** The color of each node varies from light red to dark red. The color intensity appears to represent a value or attribute associated with each node.
### Detailed Analysis or Content Details
* **Root Node:** Node 0 is at the top of the diagram and serves as the root. It is a light red color.
* **Level 1 Nodes:** Node 0 branches into nodes 1, 2, and 3. Node 1 is a medium red color. Nodes 2 and 3 are light red.
* **Level 2 Nodes:**
* Node 1 branches into nodes 4, 5, 6, 7, and 8. Node 4 is dark red. Node 5 is medium red. Nodes 6 and 7 are dark red. Node 8 is dark red.
* Node 2 branches into nodes 9 and 10. Both nodes are light red.
* Node 3 branches into nodes 11 and 12. Node 11 is light red. Node 12 is medium red.
* **Level 3 Nodes:**
* Node 4 branches into nodes 13 and 14. Both nodes are medium red.
* Node 5 branches into nodes 15, 16, 17, and 18. Nodes 15, 17, and 18 are light red. Node 16 is medium red.
* Node 6 branches into nodes 19, 20, and 21. Nodes 19, 20, and 21 are light red.
* Node 7 branches into nodes 22, 23, and 24. Nodes 22, 23, and 24 are light red.
### Key Observations
* The color gradient suggests a quantitative or qualitative attribute associated with each node. Darker red nodes might represent higher values or greater importance.
* The branching structure indicates a hierarchical relationship, where each parent node can have multiple child nodes.
* The depth of the tree varies, with some branches extending to three levels (e.g., 0 -> 1 -> 4 -> 13) and others only to two levels (e.g., 0 -> 2 -> 9).
### Interpretation
The tree diagram likely represents a system or process where nodes are related in a hierarchical manner. The color gradient could represent a metric, such as cost, frequency, or importance, associated with each node. The diagram could be used to visualize and analyze the structure and properties of the system, identifying key nodes and relationships. The nodes with darker red colors (4, 6, 7, 8) are likely more significant than the lighter red nodes. The diagram highlights the flow from the root node (0) down to the leaf nodes (13-24), showing the dependencies and connections within the system.