## Diagram: Hierarchical Tree Structure with Heatmap Encoding
### Overview
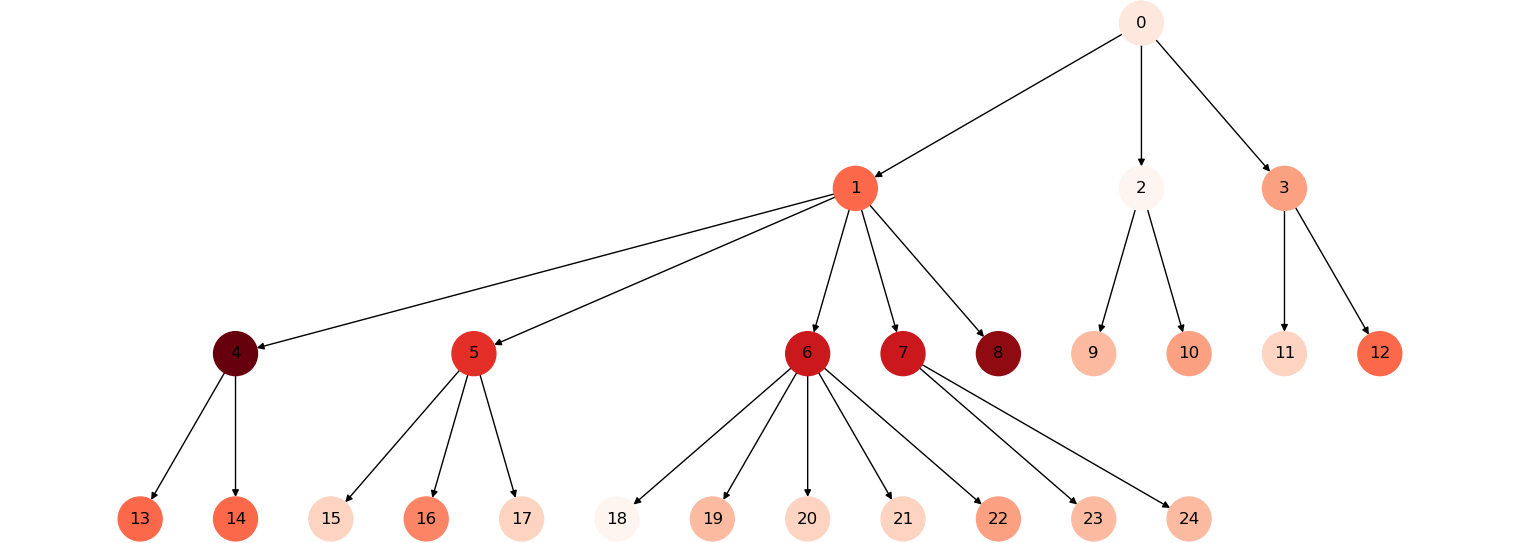
The image displays a directed tree graph consisting of 25 nodes, numbered 0 through 24. The nodes are arranged in a hierarchical structure, with Node 0 at the top (root). The nodes are color-coded using a gradient scale ranging from white/very light pink (low intensity) to deep maroon/dark red (high intensity). The structure represents a branching process or decision tree where arrows indicate the flow from parent nodes to child nodes.
### Components/Axes
* **Nodes:** Circular elements labeled with integers 0–24.
* **Edges:** Directed arrows connecting parent nodes to child nodes.
* **Color Encoding:** An implicit heatmap where color intensity correlates with a variable (likely frequency, cost, or value).
* **Lightest (White/Pale Pink):** Low intensity.
* **Medium (Orange/Pink):** Moderate intensity.
* **Darkest (Deep Maroon/Red):** High intensity.
* **Hierarchy:** The tree spans four levels of depth (Root, Level 1, Level 2, Level 3).
### Detailed Analysis
The tree structure is organized as follows:
**Level 0 (Root):**
* **Node 0:** Lightest intensity.
**Level 1 (Children of 0):**
* **Node 1:** Medium-Dark intensity.
* **Node 2:** Lightest intensity.
* **Node 3:** Medium intensity.
**Level 2 (Children of Level 1):**
* **From Node 1:**
* **Node 4:** Darkest intensity.
* **Node 5:** Medium-Dark intensity.
* **Node 6:** Darkest intensity.
* **Node 7:** Darkest intensity.
* **Node 8:** Darkest intensity.
* **From Node 2:**
* **Node 9:** Medium intensity.
* **Node 10:** Medium intensity.
* **From Node 3:**
* **Node 11:** Lightest intensity.
* **Node 12:** Medium intensity.
**Level 3 (Children of Level 2):**
* **From Node 4:**
* **Node 13:** Medium-Dark intensity.
* **Node 14:** Medium-Dark intensity.
* **From Node 5:**
* **Node 15:** Lightest intensity.
* **Node 16:** Medium intensity.
* **Node 17:** Medium intensity.
* **From Node 6:**
* **Node 18:** Lightest intensity.
* **Node 19:** Medium intensity.
* **Node 20:** Medium intensity.
* **Node 21:** Lightest intensity.
* **Node 22:** Medium intensity.
* **Node 23:** Medium intensity.
* **Node 24:** Medium intensity.
### Key Observations
* **Branching Asymmetry:** The tree is highly unbalanced. Node 1 is the most significant branch, leading to 5 children (Nodes 4-8), while Node 6 is the most prolific node at the second level, branching into 7 children (Nodes 18-24).
* **Intensity Clustering:** The "hottest" (darkest) nodes are heavily concentrated in the left-hand branch of the tree, specifically under Node 1.
* **Outliers:** Nodes 4, 6, 7, and 8 are the darkest nodes in the entire diagram. Interestingly, while Node 6 is very dark, its children (18-24) are mostly light or medium intensity, suggesting a sharp drop-off in the variable being measured after Node 6.
* **Right-Side Stability:** The right side of the tree (Nodes 2, 3, 9-12) remains consistently lighter in color, suggesting this branch represents a "cooler" or less active path in the system.
### Interpretation
This diagram likely represents a computational process, such as a decision tree, a search algorithm, or a network traffic flow.
* **Hotspot Identification:** The concentration of dark nodes under Node 1 suggests that this branch is the primary driver of the system's activity or complexity. If this were a search tree, Node 1 would likely be the path where the most computation or "pruning" occurs.
* **Process Flow:** The transition from dark nodes (e.g., Node 6) to lighter nodes (e.g., 18-24) suggests a "cooling" effect or a reduction in the measured variable as the process reaches its leaf nodes.
* **System Efficiency:** The disparity between the left branch (high intensity) and the right branch (low intensity) indicates that the system is not balanced. If this represents a load-balancing scenario, the left side is significantly overloaded compared to the right.