## Hierarchical Diagram: Node-Based Structure with Color-Coded Levels
### Overview
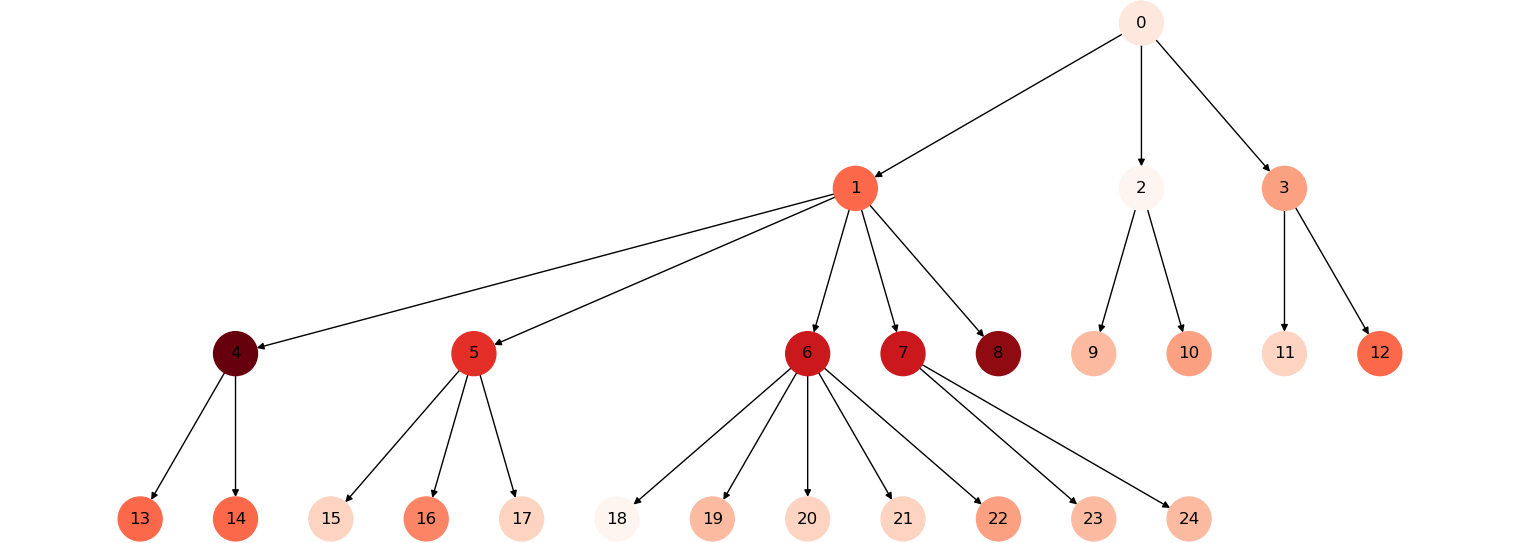
The image depicts a hierarchical tree structure with nodes labeled numerically (0–24) and connected by directed arrows. Nodes are color-coded in gradients of red, orange, and white, suggesting categorical or hierarchical distinctions. The root node (0) branches into two primary subtrees, with subsequent nodes forming a multi-level hierarchy.
### Components/Axes
- **Nodes**: Labeled 0–24, each representing discrete entities or decision points.
- **Arrows**: Directed edges indicating parent-child relationships or flow direction.
- **Color Gradient**:
- **White**: Node 0 (root).
- **Dark Red**: Nodes 4, 8.
- **Red**: Nodes 5, 6, 7.
- **Orange**: Nodes 1, 2, 3, 9, 10, 11, 12.
- **Light Orange**: Nodes 13–18, 19–24.
- **No Explicit Legend**: Color meanings are inferred from positional hierarchy and visual grouping.
### Detailed Analysis
1. **Root Node (0)**:
- Positioned at the top, connected to nodes 1 and 2.
- White color may denote the highest authority or starting point.
2. **First-Level Branches**:
- **Node 1 (Orange)**: Branches into nodes 3, 5, 6, 7, 8.
- **Node 2 (Orange)**: Branches into nodes 9, 10, 11, 12.
3. **Second-Level Branches**:
- **Node 3 (Orange)**: Connects to nodes 13, 14, 15 (light orange).
- **Node 5 (Red)**: Connects to nodes 16, 17, 18 (light orange).
- **Node 6 (Red)**: Connects to nodes 19, 20, 21, 22, 23, 24 (light orange).
- **Node 7 (Red)**: No further branches.
- **Node 8 (Dark Red)**: No further branches.
4. **Leaf Nodes**:
- Nodes 13–24 are terminal (no outgoing arrows), all light orange.
### Key Observations
- **Hierarchical Depth**: The tree has at least three levels (root → first-level → second-level).
- **Color Correlation**: Darker colors (red, dark red) cluster at higher levels, while lighter colors (orange, light orange) dominate lower levels.
- **Node 6 Complexity**: Node 6 has the most children (6 nodes), suggesting it may represent a critical or highly branched decision point.
- **Symmetry**: Nodes 1 and 2 have similar branching patterns, but node 1’s subtree is more complex.
### Interpretation
The diagram likely represents an organizational structure, decision tree, or workflow. The color gradient may indicate:
- **Hierarchical Priority**: Darker colors for higher authority (e.g., executives in white/dark red, managers in red, subordinates in orange).
- **Categorization**: Colors could denote departments, risk levels, or stages in a process.
- **Flow Dynamics**: The branching pattern suggests decision-making pathways, with node 6’s extensive children implying a high-stakes or multifaceted decision.
The absence of a legend limits precise interpretation of colors, but the structural symmetry and color progression imply a deliberate design to visualize hierarchy and relationships. Node 6’s prominence highlights its potential role as a pivotal node in the system.