## Neural Network Diagram: ViT-Based Rule Generation
### Overview
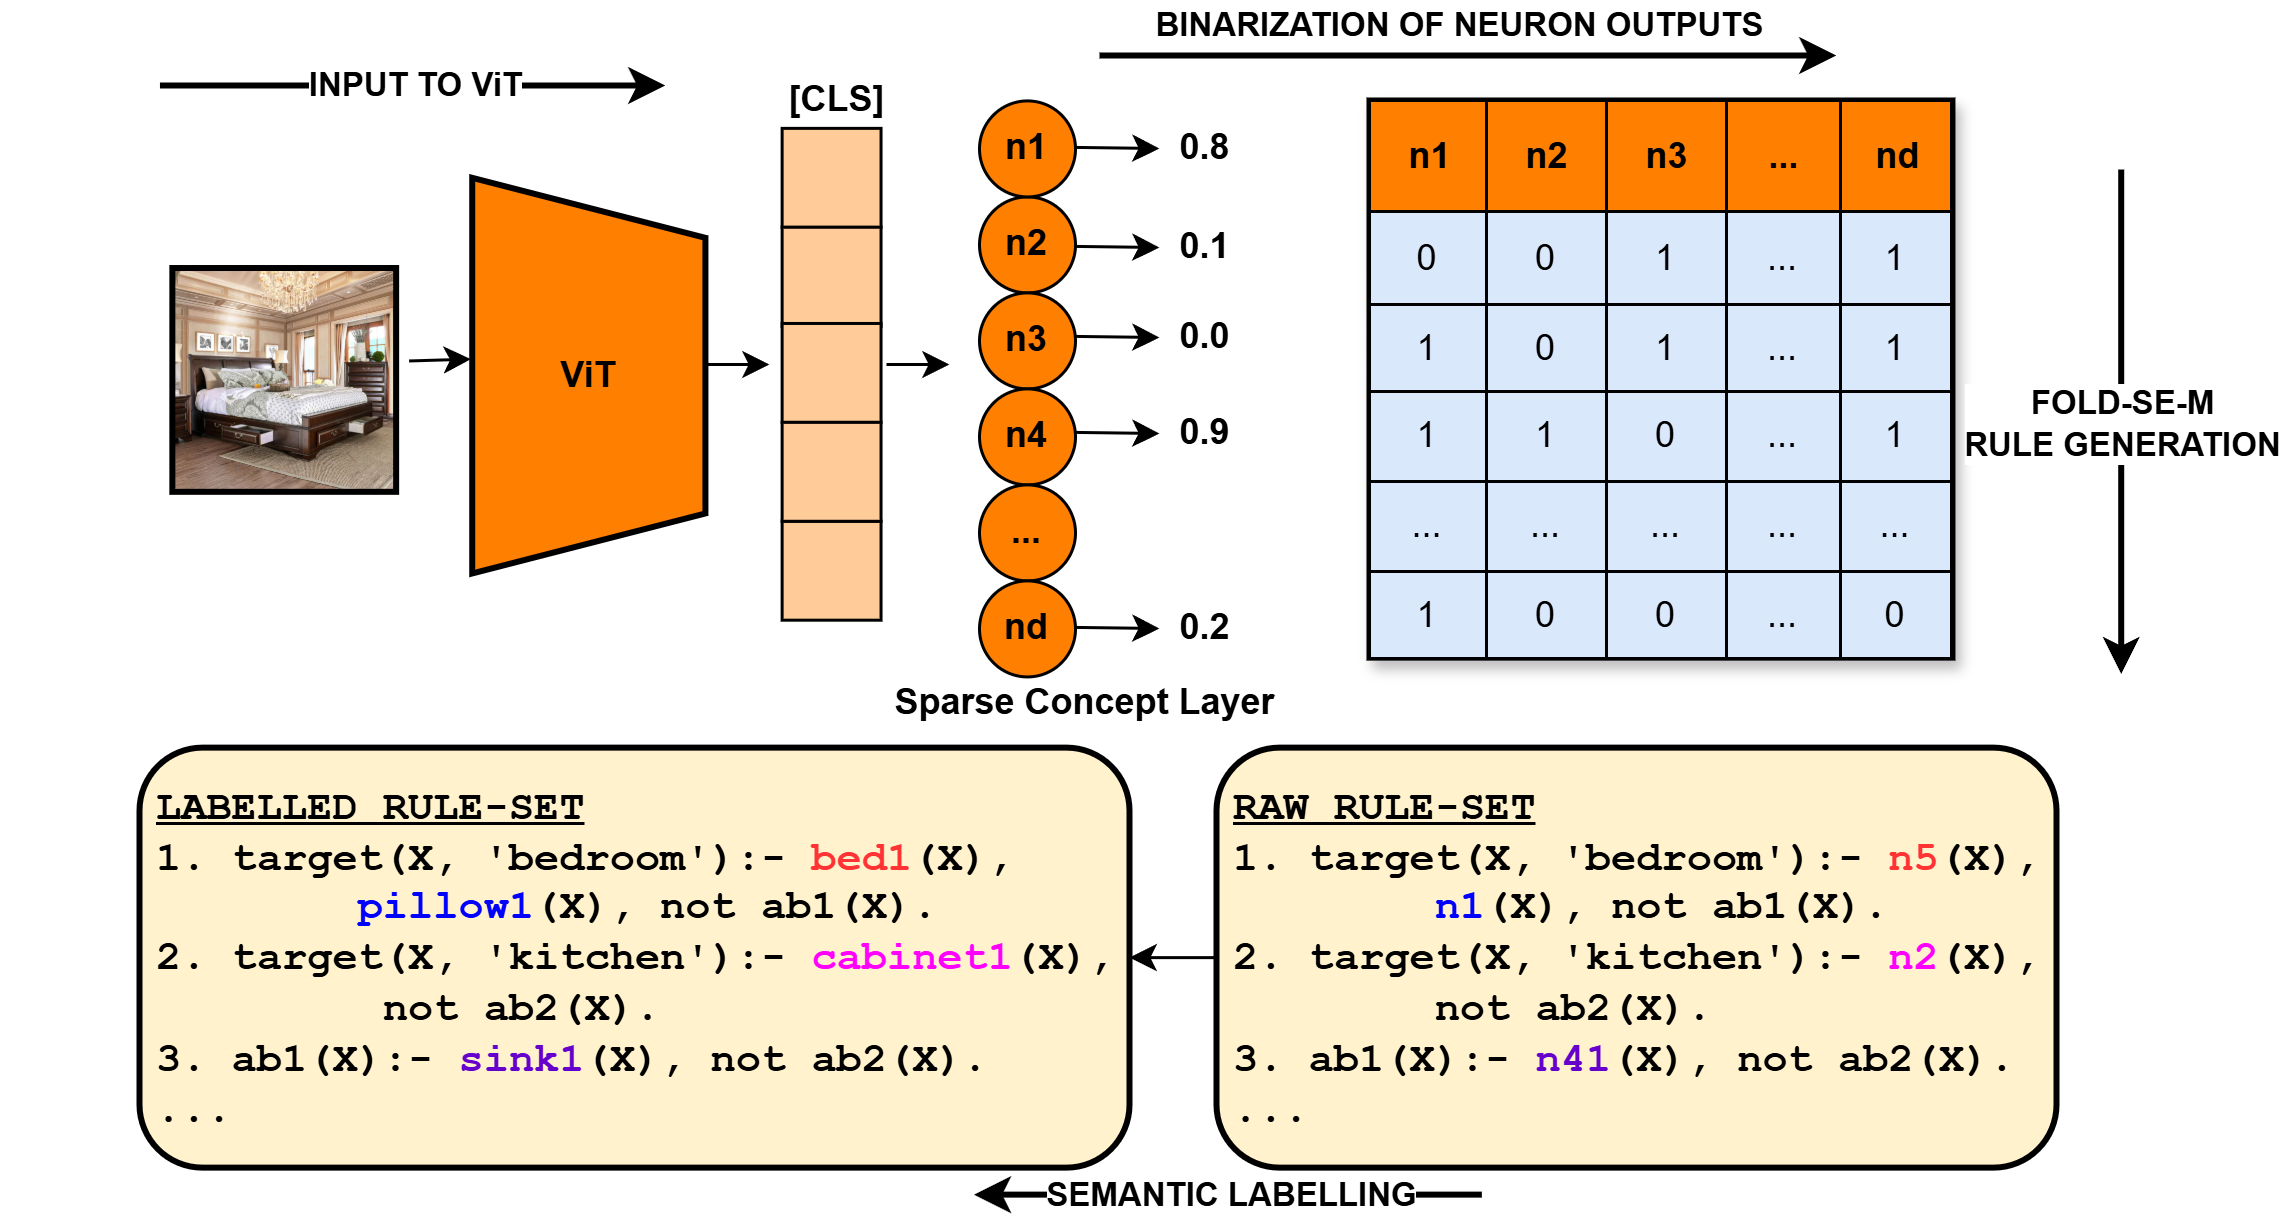
The image illustrates a process of generating rules from a Vision Transformer (ViT) model. It shows the flow from an input image to a binarized neuron output, followed by rule generation and semantic labeling.
### Components/Axes
* **Input Image:** A photograph of a bedroom.
* **Input to ViT:** An arrow pointing from the input image to the ViT block.
* **ViT:** A trapezoidal block labeled "ViT" (Vision Transformer).
* **[CLS]:** A column of orange rectangles, representing the classification token output from the ViT.
* **Sparse Concept Layer:** A layer of neurons (n1, n2, n3, n4, ..., nd) with corresponding output values (0.8, 0.1, 0.0, 0.9, ..., 0.2).
* **Binarization of Neuron Outputs:** A table showing the binarized outputs of the neurons. The columns are labeled n1, n2, n3, ..., nd. The rows represent different patterns of neuron activation.
* **FOLD-SE-M Rule Generation:** An arrow pointing downwards from the binarization table, indicating the rule generation process.
* **RAW RULE-SET:** A block of text containing rules generated directly from the neuron outputs.
* **LABELLED RULE-SET:** A block of text containing semantically labeled rules.
* **SEMANTIC LABELLING:** An arrow pointing from the "LABELLED RULE-SET" to the "RAW RULE-SET", indicating the semantic labeling process.
### Detailed Analysis
**1. Input Image and ViT:**
* The input image is a bedroom scene.
* The ViT processes the image and generates a classification token.
**2. Sparse Concept Layer:**
* The neurons n1, n2, n3, n4, and nd have output values of approximately 0.8, 0.1, 0.0, 0.9, and 0.2, respectively.
* The values represent the activation levels of these neurons.
**3. Binarization of Neuron Outputs:**
The table represents the binarized outputs of the neurons. The values are either 0 or 1.
| | n1 | n2 | n3 | ... | nd |
| :---- | :-- | :-- | :-- | :-- | :-- |
| Row 1 | 0 | 0 | 1 | ... | 1 |
| Row 2 | 1 | 0 | 1 | ... | 1 |
| Row 3 | 1 | 1 | 0 | ... | 1 |
| ... | ... | ... | ... | ... | ... |
| Row N | 1 | 0 | 0 | ... | 0 |
**4. Rule Sets:**
* **RAW RULE-SET:**
1. `target(X, 'bedroom'):- n5(X), n1(X), not ab1(X).`
2. `target(X, 'kitchen'):- n2(X), not ab2(X).`
3. `ab1(X):- n41(X), not ab2(X).`
4. `...`
* **LABELLED RULE-SET:**
1. `target(X, 'bedroom'):- bed1(X), pillow1(X), not ab1(X).`
2. `target(X, 'kitchen'):- cabinet1(X), not ab2(X).`
3. `ab1(X):- sink1(X), not ab2(X).`
4. `...`
### Key Observations
* The diagram illustrates a pipeline for generating rules from visual data using a ViT model.
* The sparse concept layer represents an intermediate representation of the image.
* The binarization process converts the continuous neuron outputs into binary values.
* The FOLD-SE-M algorithm generates rules based on these binary patterns.
* Semantic labeling refines the rules by replacing neuron activations with meaningful concepts.
### Interpretation
The diagram demonstrates a method for extracting symbolic knowledge from visual data using a Vision Transformer. The process involves transforming an image into a set of neuron activations, binarizing these activations, and then generating rules based on the resulting binary patterns. Finally, semantic labeling is used to refine the rules and make them more interpretable. This approach could be used to build AI systems that can reason about visual scenes and make decisions based on learned rules. The transformation from RAW RULE-SET to LABELLED RULE-SET is a critical step in making the rules human-understandable and actionable.