## Bar Chart: Mean Absolute Error vs. Averaging Period
### Overview
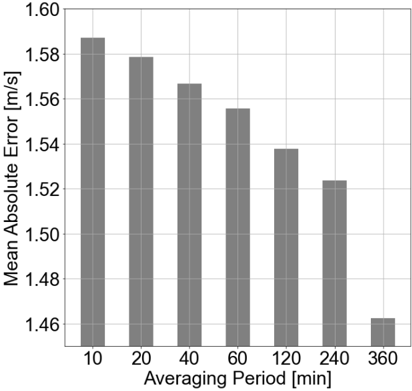
The image is a bar chart illustrating the relationship between the averaging period (in minutes) and the mean absolute error (in meters per second). The chart shows how the mean absolute error decreases as the averaging period increases.
### Components/Axes
* **X-axis:** Averaging Period [min]. The x-axis is labeled "Averaging Period [min]" and has the following values: 10, 20, 40, 60, 120, 240, 360.
* **Y-axis:** Mean Absolute Error [m/s]. The y-axis is labeled "Mean Absolute Error [m/s]" and ranges from 1.46 to 1.60, with tick marks at intervals of 0.02.
* **Bars:** There are seven gray bars, each corresponding to a different averaging period.
### Detailed Analysis
The chart displays the mean absolute error for different averaging periods. The bars are arranged in ascending order of averaging period (from left to right).
* **Averaging Period 10 min:** Mean Absolute Error is approximately 1.585 m/s.
* **Averaging Period 20 min:** Mean Absolute Error is approximately 1.578 m/s.
* **Averaging Period 40 min:** Mean Absolute Error is approximately 1.567 m/s.
* **Averaging Period 60 min:** Mean Absolute Error is approximately 1.556 m/s.
* **Averaging Period 120 min:** Mean Absolute Error is approximately 1.538 m/s.
* **Averaging Period 240 min:** Mean Absolute Error is approximately 1.523 m/s.
* **Averaging Period 360 min:** Mean Absolute Error is approximately 1.463 m/s.
### Key Observations
* The mean absolute error generally decreases as the averaging period increases.
* The most significant drop in mean absolute error occurs between the 240-minute and 360-minute averaging periods.
* The mean absolute error appears to stabilize after the 240-minute averaging period.
### Interpretation
The chart suggests that increasing the averaging period reduces the mean absolute error. This could be due to the longer averaging period smoothing out short-term fluctuations or noise in the data, leading to a more stable and accurate estimate. The diminishing returns observed after 240 minutes suggest that there is a point beyond which increasing the averaging period provides little additional benefit in terms of reducing the mean absolute error.