## Diagram: Network Structure
### Overview
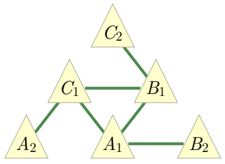
The image displays a diagram representing a network structure composed of several nodes, labeled with alphanumeric identifiers, connected by lines. The nodes are depicted as light yellow triangles with a beige border, and the connections are represented by thick green lines.
### Components/Axes
There are no explicit axes or legends in this diagram. The components are the nodes and the connecting lines.
The nodes are labeled as follows:
* A1
* A2
* B1
* B2
* C1
* C2
The connecting lines represent relationships or connections between these nodes.
### Detailed Analysis
The diagram shows the following connections:
* A1 is connected to A2.
* A1 is connected to B1.
* A1 is connected to B2.
* A2 is connected to C1.
* B1 is connected to B2.
* B1 is connected to C1.
* B1 is connected to C2.
* C1 is connected to C2.
The spatial arrangement suggests a hierarchical or layered structure, with nodes A1 and A2 at a lower level, B1 and B2 at a middle level, and C1 and C2 at a higher level. However, the connections do not strictly adhere to a simple layered model.
### Key Observations
* Node A1 is highly connected, linking to nodes in different potential "layers" (A2, B1, B2).
* Node B1 is also highly connected, linking to nodes A1, B2, C1, and C2.
* Nodes A2, B2, and C2 appear to be less central in terms of direct connections compared to A1 and B1.
* There are no isolated nodes; all nodes are part of the network.
### Interpretation
This diagram illustrates a graph representing a network. The nodes (A1, A2, B1, B2, C1, C2) can be interpreted as entities, devices, or points in a system, and the green lines represent the communication links, relationships, or dependencies between them.
The structure suggests a non-trivial network topology. The high connectivity of nodes A1 and B1 indicates they might be central hubs or critical points within this network. The arrangement could represent various scenarios, such as:
* **A communication network:** Where nodes are routers or servers and lines are network links.
* **A social network:** Where nodes are individuals and lines represent friendships or interactions.
* **A dependency graph:** Where nodes are tasks or components and lines indicate prerequisites or integrations.
Without further context, it is difficult to definitively state the exact nature of the network. However, the visual representation clearly defines the interconnections between the labeled entities. The diagram is purely topological, conveying relationships rather than physical layout or data flow rates.