## Hierarchical Diagram: Node Relationships
### Overview
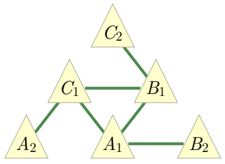
The image depicts a hierarchical network of six triangular nodes labeled A1, A2, B1, B2, C1, and C2. Green lines connect nodes in a structured, tiered arrangement, suggesting dependencies or relationships between components. The diagram lacks a legend, axis titles, or numerical data, focusing purely on structural relationships.
### Components/Axes
- **Nodes**:
- Bottom tier: A1 (central), A2 (left)
- Middle tier: B1 (right), C1 (left)
- Top tier: C2 (center)
- **Connections**:
- A1 ↔ A2 (horizontal)
- A1 ↔ B1 (diagonal)
- A1 ↔ C1 (diagonal)
- B1 ↔ B2 (horizontal)
- B1 ↔ C1 (diagonal)
- C1 ↔ C2 (vertical)
- **Legend**: Absent. Line color (green) is uniform but lacks explicit meaning.
### Detailed Analysis
- **Node Placement**:
- A1 is centrally located at the base, acting as a root node with three outgoing connections.
- A2 branches left from A1, forming a secondary path.
- B1 and C1 occupy the middle tier, with B1 connecting to B2 (right) and C1 connecting upward to C2.
- C2 sits at the apex, directly linked to C1.
- **Flow Direction**:
- Primary flow is upward (A → B → C), with lateral connections (A1 ↔ A2, B1 ↔ B2).
- No feedback loops or bidirectional arrows are present.
### Key Observations
1. **Centrality of A1**: A1 serves as the primary hub, connecting to all other nodes except B2 and C2.
2. **Symmetry**: The diagram exhibits partial symmetry, with A1 and B1 both having two outgoing connections.
3. **Missing Labels**: No explicit labels for edges or nodes beyond alphanumeric identifiers (e.g., "A1" instead of descriptive terms).
4. **Color Uniformity**: All connections use green lines, but no legend clarifies their significance (e.g., strength, type of relationship).
### Interpretation
This diagram likely represents a **decision tree**, **organizational hierarchy**, or **data flow architecture**. The absence of a legend limits interpretation of line colors, but the tiered structure implies:
- **Dependency Chains**: Lower-tier nodes (A1, A2) feed into middle-tier nodes (B1, C1), which in turn influence the top-tier node (C2).
- **Redundancy**: A1’s multiple connections suggest it may represent a critical decision point with branching outcomes.
- **Isolation of C2**: C2 has no outgoing connections, indicating it may represent a final state or endpoint.
The lack of numerical data or explicit labels makes quantitative analysis impossible. However, the hierarchical design emphasizes **modularity** and **sequential processing**, common in systems where inputs (A-tier) are transformed through intermediate stages (B/C-tier) to produce outputs (C2).