## Diagram: Neural Network Representations
### Overview
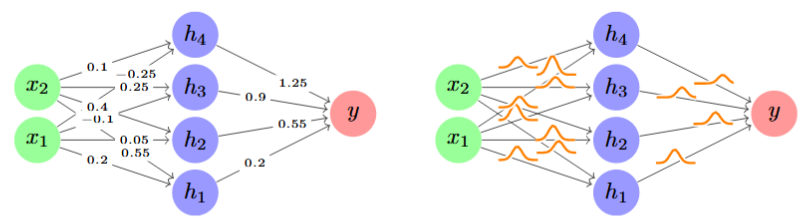
The image presents two diagrams of a simple neural network. The left diagram shows the network with numerical weights assigned to each connection, while the right diagram illustrates the same network with orange curves on the connections, possibly representing activation functions or distributions.
### Components/Axes
* **Nodes:**
* Input nodes: x1, x2 (green circles)
* Hidden layer nodes: h1, h2, h3, h4 (blue circles)
* Output node: y (red circle)
* **Connections:** Arrows indicating the flow of information between nodes.
* **Weights (Left Diagram):** Numerical values associated with each connection, representing the strength of the connection.
* **Curves (Right Diagram):** Orange curves on the connections, possibly representing activation functions or distributions.
### Detailed Analysis or ### Content Details
**Left Diagram (Numerical Weights):**
* **Connections from x2:**
* x2 to h4: 0.1
* x2 to h3: -0.25
* x2 to h2: 0.05
* x2 to h1: 0.2
* **Connections from x1:**
* x1 to h4: 0.4
* x1 to h3: 0.25
* x1 to h2: 0.55
* x1 to h1: -0.1
* **Connections to y:**
* h4 to y: 1.25
* h3 to y: 0.9
* h2 to y: 0.55
* h1 to y: 0.2
**Right Diagram (Curves on Connections):**
* The network structure is identical to the left diagram.
* Each connection has an orange curve on it. The shape of the curve varies slightly between connections. These curves likely represent activation functions or probability distributions associated with the connections.
### Key Observations
* The left diagram provides specific numerical weights for each connection in the neural network.
* The right diagram replaces the numerical weights with curves, suggesting a different representation of the connection strength or the transformation applied to the signal passing through the connection.
* The input nodes are x1 and x2, the hidden layer has nodes h1, h2, h3, and h4, and the output node is y.
### Interpretation
The image illustrates two different ways of representing a neural network. The left diagram uses numerical weights to quantify the strength of each connection, which is a common representation in many neural network models. The right diagram uses curves on the connections, which could represent activation functions, probability distributions, or some other form of transformation applied to the signal as it passes through the connection. The curves provide a more abstract representation of the network's behavior compared to the numerical weights. The curves could represent the uncertainty or variability associated with each connection.