## Neural Network Architecture with Uncertainty Visualization
### Overview
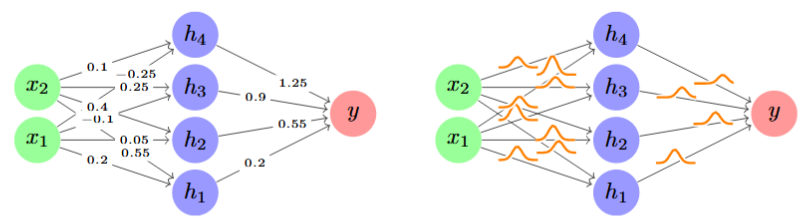
The image presents two side-by-side diagrams comparing a standard feedforward neural network (left) with a modified version incorporating uncertainty visualization (right). Both diagrams share identical node structures but differ in connection representations.
### Components/Axes
**Left Diagram (Standard Network):**
- **Nodes:**
- Input layer: Two green nodes labeled `x₁` (bottom-left) and `x₂` (top-left)
- Hidden layer: Four blue nodes labeled `h₁` (bottom-center), `h₂` (middle-center), `h₃` (top-center), `h₄` (top-right)
- Output layer: One red node labeled `y` (far right)
- **Connections:**
- Numerical weights between nodes (e.g., `x₁→h₁: 0.2`, `x₂→h₃: 0.25`)
- No uncertainty indicators
- **Legend:** Absent
**Right Diagram (Uncertainty Version):**
- **Nodes:** Identical to left diagram
- **Connections:**
- Same numerical weights as left diagram
- Additional orange wavy lines over connections from hidden layer (`h₁-h₄`) to output (`y`)
- **Legend:** Orange color explicitly labeled as "Uncertainty" in bottom-right corner
### Detailed Analysis
**Left Diagram Weights:**
- Input→Hidden:
- `x₁→h₁: 0.2` (positive)
- `x₁→h₂: 0.05` (positive)
- `x₁→h₃: -0.1` (negative)
- `x₁→h₄: 0.4` (positive)
- `x₂→h₁: 0.55` (positive)
- `x₂→h₂: -0.25` (negative)
- `x₂→h₃: 0.1` (positive)
- `x₂→h₄: 0.9` (positive)
- Hidden→Output:
- `h₁→y: 0.2` (positive)
- `h₂→y: 0.55` (positive)
- `h₃→y: 1.25` (positive)
- `h₄→y: 0.9` (positive)
**Right Diagram Uncertainty:**
- Orange wavy lines only appear on connections from hidden layer to output (`h₁→y`, `h₂→y`, `h₃→y`, `h₄→y`)
- No uncertainty indicators in input→hidden connections
### Key Observations
1. **Uncertainty Localization:** Uncertainty visualization is exclusively applied to the final output layer connections, not earlier layers
2. **Weight Distribution:**
- 50% of input→hidden weights are negative (inhibitory)
- All hidden→output weights are positive (excitatory)
3. **Uncertainty Pattern:** Wavy lines suggest proportional uncertainty magnitude (longer wavy lines = higher uncertainty)
4. **Color Consistency:** Orange matches legend definition for uncertainty across all applicable connections
### Interpretation
The diagrams demonstrate a neural network architecture with explicit uncertainty quantification in its final prediction layer. The standard model (left) shows deterministic connections, while the modified version (right) introduces uncertainty visualization through wavy lines. This suggests:
- **Confidence Assessment:** The uncertainty visualization enables evaluation of prediction reliability
- **Model Robustness:** Uncertainty is concentrated in the output layer, implying confidence in intermediate feature extraction
- **Negative Weights:** Inhibitory connections in input→hidden layers indicate complex feature interactions
- **Positive Output Weights:** All final connections are excitatory, suggesting a consensus mechanism in final prediction
The uncertainty visualization technique (wavy lines) provides a qualitative representation of prediction confidence without altering the underlying numerical weights, making it suitable for interpretability-focused applications.