## Bar and Line Chart: Model Performance vs. Training Samples
### Overview
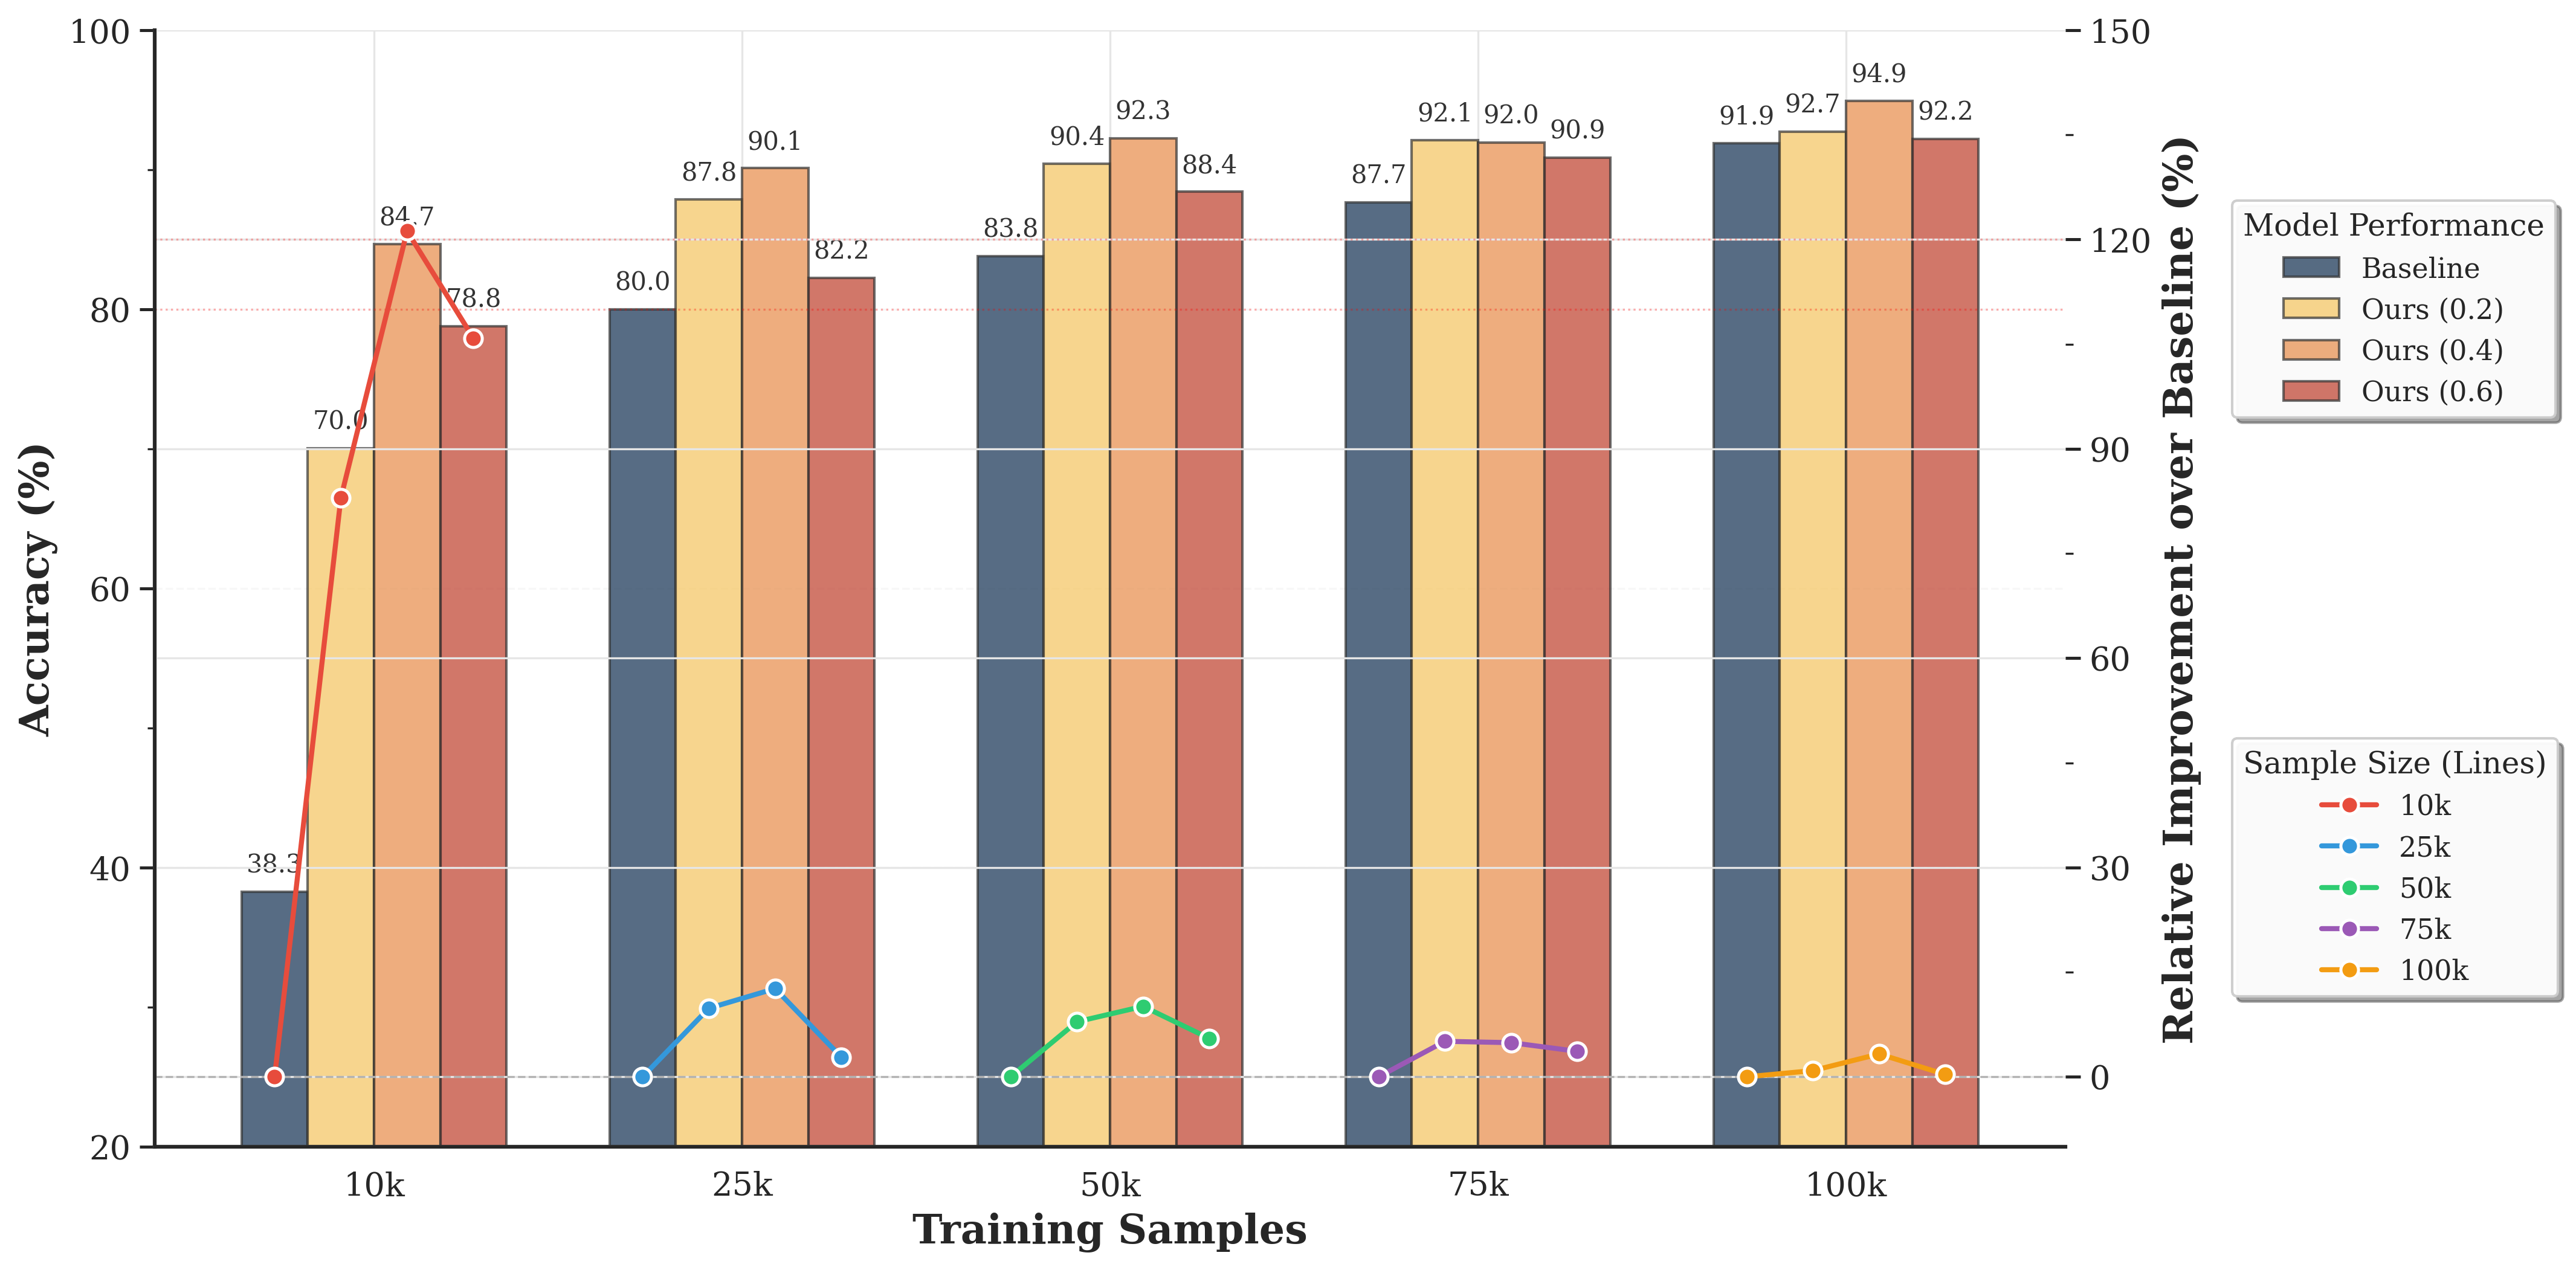
The image is a combination of a bar chart and a line chart, displaying the performance of different models (Baseline, Ours (0.2), Ours (0.4), Ours (0.6)) across varying training sample sizes (10k, 25k, 50k, 75k, 100k). The bar chart shows the accuracy (%) of each model, while the line chart shows the relative improvement over the baseline for different sample sizes.
### Components/Axes
* **X-axis:** Training Samples (10k, 25k, 50k, 75k, 100k)
* **Left Y-axis:** Accuracy (%) - Scale from 20 to 100
* **Right Y-axis:** Relative Improvement over Baseline (%) - Scale from 0 to 150
* **Bar Chart Legend (Model Performance):** Located in the top-right corner.
* Baseline (Dark Blue)
* Ours (0.2) (Light Yellow)
* Ours (0.4) (Orange)
* Ours (0.6) (Red-Brown)
* **Line Chart Legend (Sample Size):** Located in the bottom-right corner.
* 10k (Red)
* 25k (Blue)
* 50k (Green)
* 75k (Purple)
* 100k (Yellow-Orange)
### Detailed Analysis
**Bar Chart Data (Accuracy %):**
* **10k Training Samples:**
* Baseline: 38.3%
* Ours (0.2): 70.0%
* Ours (0.4): 84.7%
* Ours (0.6): 78.8%
* **25k Training Samples:**
* Baseline: 80.0%
* Ours (0.2): 87.8%
* Ours (0.4): 90.1%
* Ours (0.6): 82.2%
* **50k Training Samples:**
* Baseline: 83.8%
* Ours (0.2): 90.4%
* Ours (0.4): 92.3%
* Ours (0.6): 88.4%
* **75k Training Samples:**
* Baseline: 87.7%
* Ours (0.2): 92.1%
* Ours (0.4): 92.0%
* Ours (0.6): 90.9%
* **100k Training Samples:**
* Baseline: 91.9%
* Ours (0.2): 94.9%
* Ours (0.4): 92.7%
* Ours (0.6): 92.2%
**Line Chart Data (Relative Improvement over Baseline %):**
* **10k (Red):** Starts at approximately 0% at 0k, rises sharply to approximately 120% at 10k.
* **25k (Blue):** Starts at approximately 0% at 0k, rises to approximately 10% at 25k.
* **50k (Green):** Starts at approximately 0% at 0k, rises to approximately 5% at 50k.
* **75k (Purple):** Starts at approximately 0% at 0k, rises to approximately 3% at 75k.
* **100k (Yellow-Orange):** Starts at approximately 0% at 0k, rises to approximately 2% at 100k.
### Key Observations
* The "Ours" models consistently outperform the "Baseline" model in terms of accuracy across all training sample sizes.
* The "Ours (0.4)" model generally achieves the highest accuracy among the "Ours" models, but the differences are small at larger sample sizes.
* The relative improvement over the baseline is highest for the 10k sample size, indicating that the "Ours" models provide the most significant benefit when training data is limited.
* As the training sample size increases, the relative improvement over the baseline decreases for all sample sizes.
### Interpretation
The data suggests that the "Ours" models are effective in improving accuracy compared to the "Baseline" model, especially when the training data is limited. The diminishing returns in relative improvement as the sample size increases indicate that the "Ours" models may be most valuable in scenarios where acquiring large datasets is challenging or expensive. The "Ours (0.4)" model appears to be a good choice overall, but the optimal model may depend on the specific trade-offs between accuracy and computational cost.