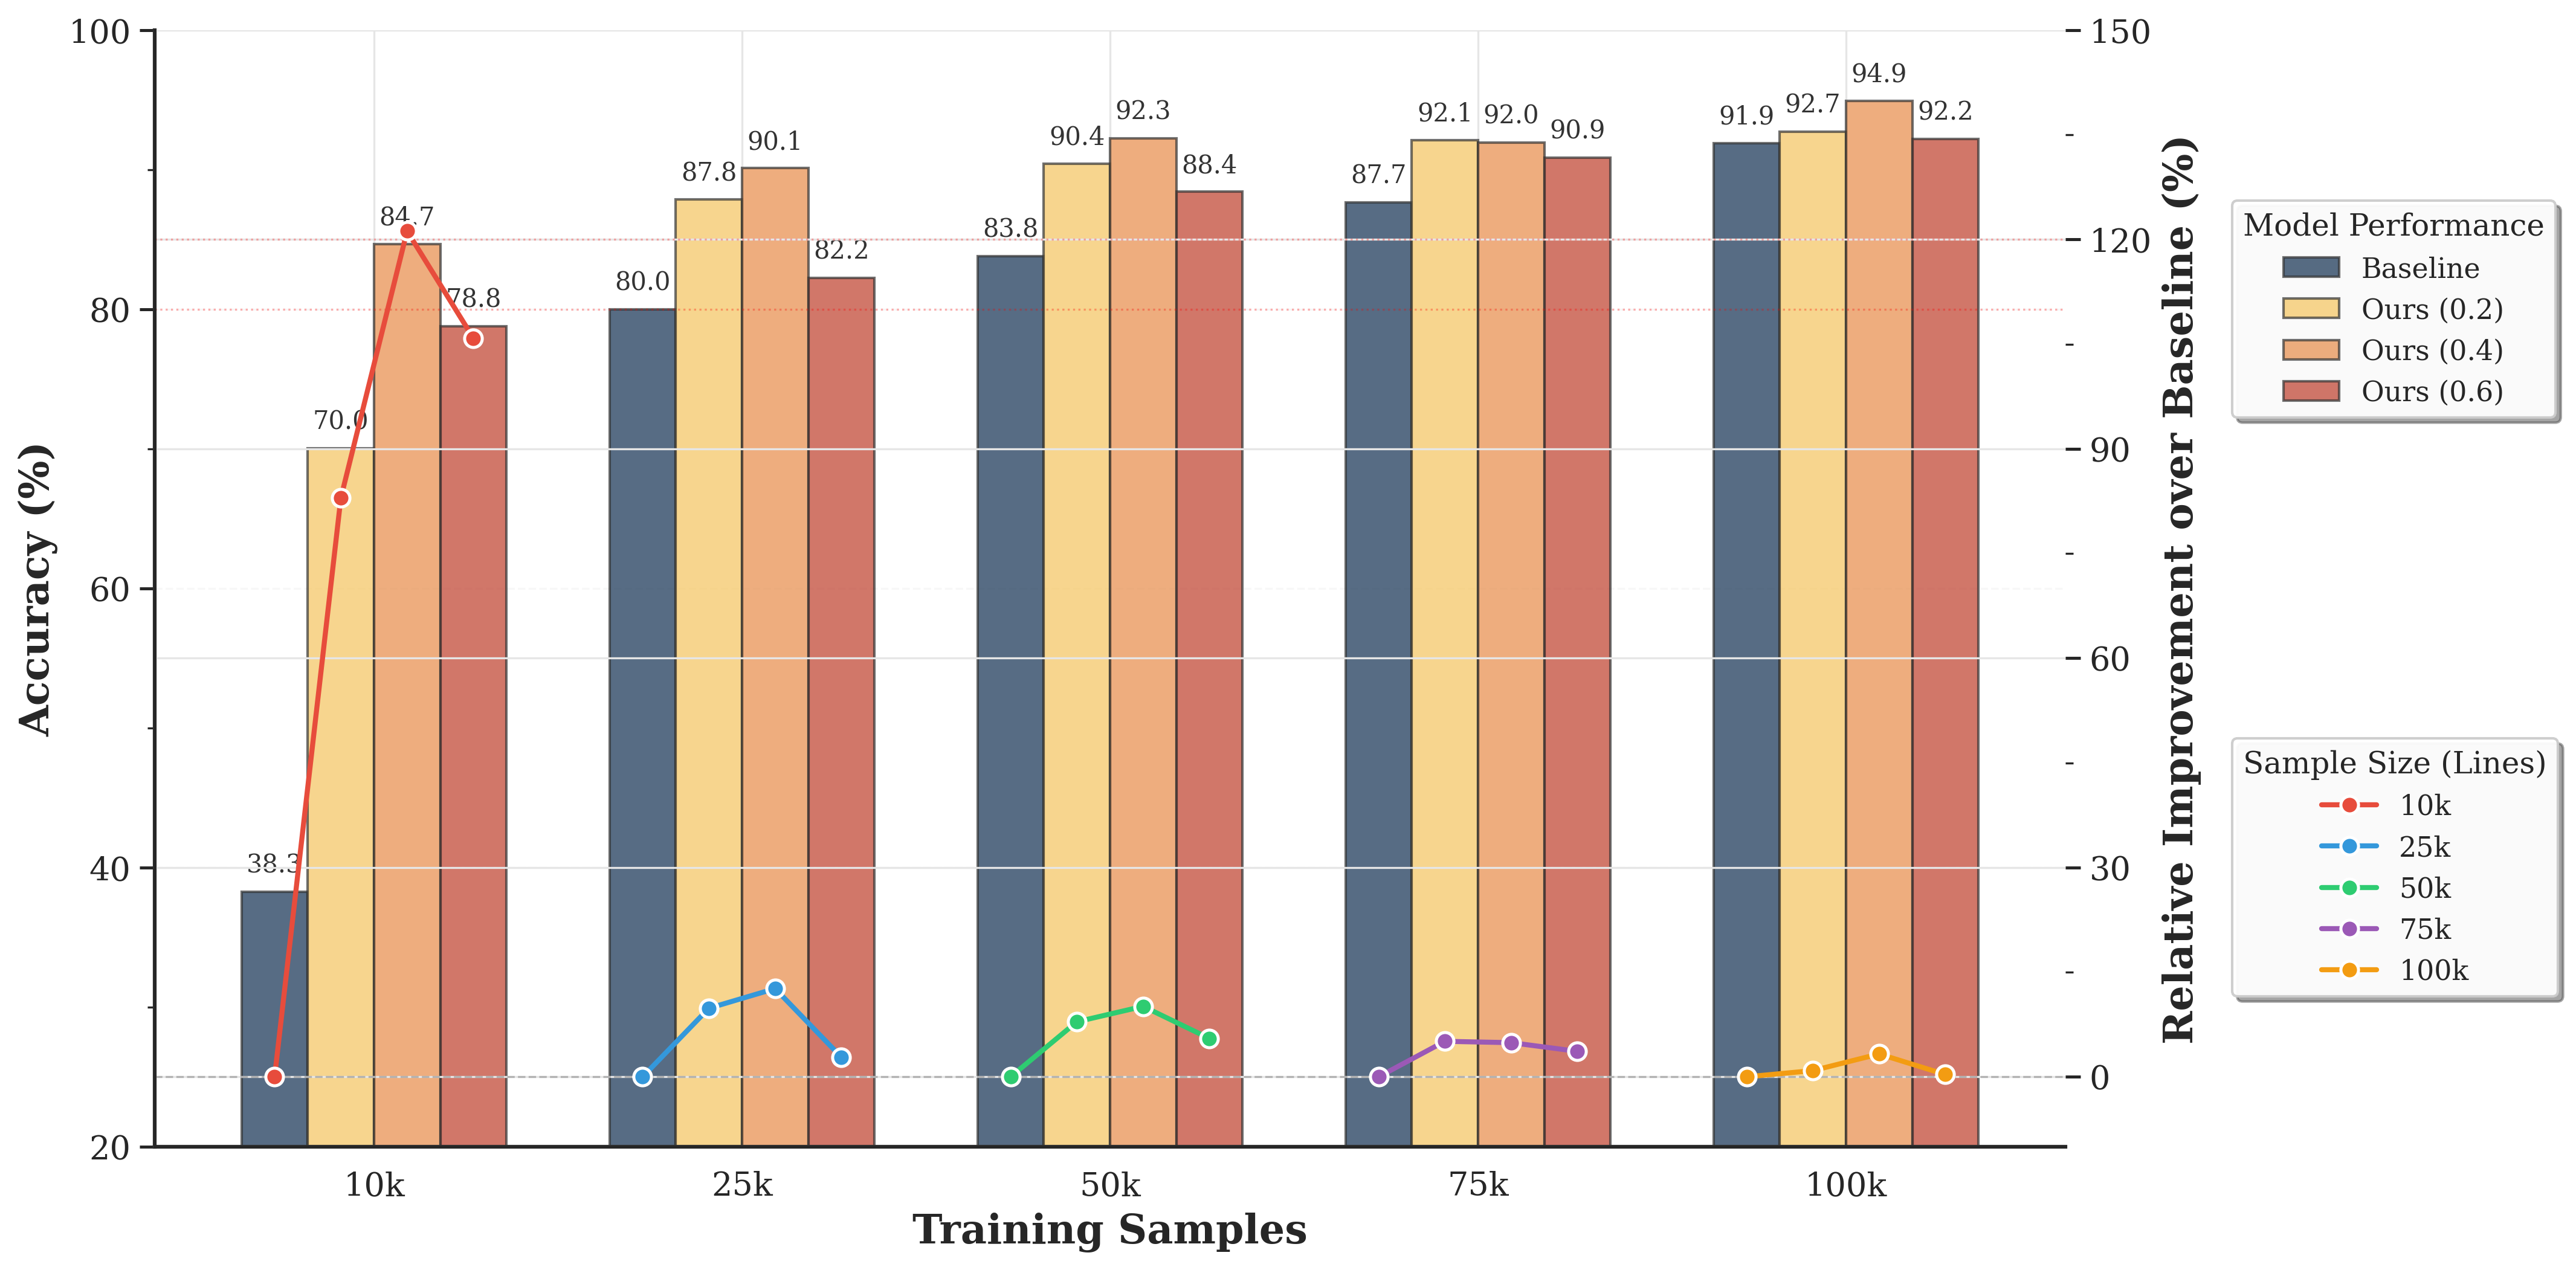
## Bar Chart: Model Accuracy vs. Training Sample Size
### Overview
This chart compares the accuracy of a baseline model and several variations of "Ours" models (with parameters 0.2, 0.4, and 0.6) across different training sample sizes (10k, 25k, 50k, 75k, and 100k). A secondary y-axis displays the relative improvement of the "Ours" models over the baseline. The chart uses bar graphs to represent accuracy and line graphs to represent relative improvement.
### Components/Axes
* **X-axis:** Training Samples (10k, 25k, 50k, 75k, 100k)
* **Left Y-axis:** Accuracy (%) - Scale ranges from 20 to 100.
* **Right Y-axis:** Relative Improvement over Baseline (%) - Scale ranges from -150 to 0.
* **Legend (Top-Right):**
* Baseline (Blue)
* Ours (0.2) (Red)
* Ours (0.4) (Green)
* Ours (0.6) (Yellow)
* **Legend (Bottom-Right):**
* Sample Size (Lines)
* 10k (Red)
* 25k (Blue)
* 50k (Green)
* 75k (Yellow)
* 100k (Orange)
### Detailed Analysis
The chart consists of bar graphs representing accuracy and line graphs representing relative improvement.
**Accuracy (Bar Graphs):**
* **10k Training Samples:** Baseline accuracy is approximately 38.3%. Ours (0.2) is 70.0%, Ours (0.4) is 84.7%, and Ours (0.6) is 88.0%.
* **25k Training Samples:** Baseline accuracy is approximately 82.2%. Ours (0.2) is 87.8%, Ours (0.4) is 90.1%, and Ours (0.6) is 88.4%.
* **50k Training Samples:** Baseline accuracy is approximately 83.8%. Ours (0.2) is 90.4%, Ours (0.4) is 92.3%, and Ours (0.6) is 87.7%.
* **75k Training Samples:** Baseline accuracy is approximately 92.0%. Ours (0.2) is 92.1%, Ours (0.4) is 90.9%, and Ours (0.6) is 91.9%.
* **100k Training Samples:** Baseline accuracy is approximately 92.2%. Ours (0.2) is 94.9%, Ours (0.4) is 92.7%, and Ours (0.6) is 91.9%.
**Relative Improvement (Line Graphs):**
* **Ours (0.2) - 10k:** Approximately 83% relative improvement. The line slopes downward.
* **Ours (0.2) - 25k:** Approximately 7% relative improvement.
* **Ours (0.2) - 50k:** Approximately 7% relative improvement.
* **Ours (0.2) - 75k:** Approximately 0% relative improvement.
* **Ours (0.2) - 100k:** Approximately 3% relative improvement.
* **Ours (0.4) - 10k:** Approximately 120% relative improvement. The line slopes downward.
* **Ours (0.4) - 25k:** Approximately 10% relative improvement.
* **Ours (0.4) - 50k:** Approximately 10% relative improvement.
* **Ours (0.4) - 75k:** Approximately 0% relative improvement.
* **Ours (0.4) - 100k:** Approximately 2% relative improvement.
* **Ours (0.6) - 10k:** Approximately 130% relative improvement. The line slopes downward.
* **Ours (0.6) - 25k:** Approximately 7% relative improvement.
* **Ours (0.6) - 50k:** Approximately 5% relative improvement.
* **Ours (0.6) - 75k:** Approximately 0% relative improvement.
* **Ours (0.6) - 100k:** Approximately 0% relative improvement.
### Key Observations
* All "Ours" models significantly outperform the baseline model at 10k training samples.
* As the training sample size increases, the relative improvement of the "Ours" models over the baseline decreases.
* At 75k and 100k training samples, the relative improvement of the "Ours" models approaches zero.
* The "Ours (0.4)" model consistently achieves the highest accuracy across all training sample sizes.
* The "Ours (0.6)" model shows the largest initial improvement at 10k samples, but its performance plateaus earlier than the other "Ours" models.
### Interpretation
The data suggests that the "Ours" models are particularly beneficial when training data is limited. The substantial improvement at 10k samples indicates that these models can effectively learn from smaller datasets. However, as the amount of training data increases, the advantage of the "Ours" models diminishes, and they converge towards the performance of the baseline model. This could indicate that the "Ours" models incorporate a regularization or data augmentation technique that is less necessary with larger datasets.
The "Ours (0.4)" model appears to be the most robust, maintaining high accuracy across all training sample sizes. The initial high improvement of "Ours (0.6)" suggests a strong inductive bias, but this bias may become less effective as more data becomes available.
The convergence of all models at higher sample sizes suggests that the dataset size is becoming the dominant factor in performance, overshadowing the differences in model architecture or training procedure. This highlights the importance of data quantity in achieving high accuracy, especially when the models are sufficiently complex.