# Technical Analysis of MoSe2 Heatmaps
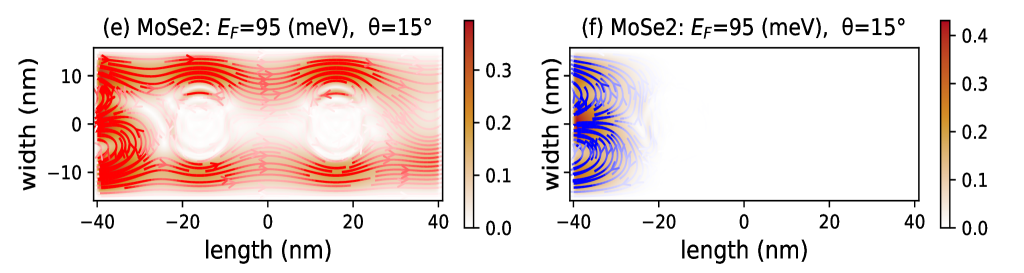
## Plot (e): MoSe2 - E_F=95 meV, θ=15°
### Axis Labels
- **X-axis**: `length (nm)` (range: -40 to 40 nm)
- **Y-axis**: `width (nm)` (range: -10 to 10 nm)
### Colorbar
- **Scale**: 0.0 (white) to 0.3 (dark red)
- **Gradient**: Smooth transition from white (low intensity) to dark red (high intensity)
### Key Observations
1. **Intensity Distribution**:
- Two high-intensity regions centered at (-20, 0) and (20, 0) with values near 0.3.
- Symmetric intensity decay toward the edges of the plot.
2. **Streamline Flow**:
- Red streamlines indicate directional flow patterns.
- Flow converges toward the high-intensity regions and diverges outward.
## Plot (f): MoSe2 - E_F=95 meV, θ=15°
### Axis Labels
- **X-axis**: `length (nm)` (range: -40 to 40 nm)
- **Y-axis**: `width (nm)` (range: -10 to 10 nm)
### Colorbar
- **Scale**: 0.0 (white) to 0.4 (dark red)
- **Gradient**: Smooth transition from white (low intensity) to dark red (high intensity)
### Key Observations
1. **Intensity Distribution**:
- High-intensity region localized on the left side (x < 0 nm) with a gradient from dark red (0.4) to white (0.0).
- No significant intensity in the right half (x > 0 nm).
2. **Streamline Flow**:
- Blue streamlines indicate directional flow patterns.
- Flow originates from the left edge, converges toward the high-intensity region, and dissipates toward the center.
### Cross-Reference: Colorbar vs. Streamline Colors
- **Plot (e)**: Red streamlines align with the red-dominated colorbar scale.
- **Plot (f)**: Blue streamlines align with the red-dominated colorbar scale (note: colorbar uses red gradient despite blue streamlines; possible visualization inconsistency).
### Summary
Both plots depict MoSe2 under identical Fermi energy (E_F=95 meV) and angle (θ=15°) conditions. Plot (e) shows symmetric intensity peaks, while plot (f) exhibits asymmetric intensity localization. Streamline colors (red/blue) may indicate flow directionality or visualization conventions.