## Log-Log Plot: Gradient Updates vs. Dimension
### Overview
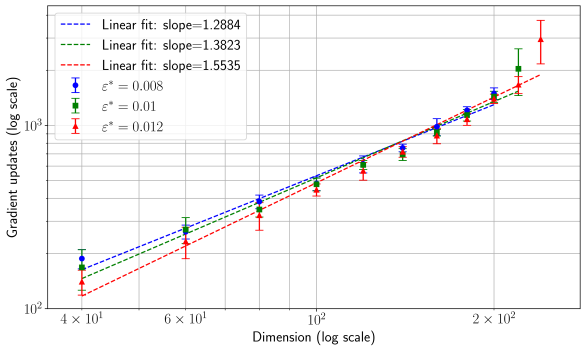
The image is a log-log plot showing the relationship between gradient updates and dimension for three different values of epsilon (ε*). The plot includes linear fits for each epsilon value, along with error bars for the data points. The x and y axes are both on a logarithmic scale.
### Components/Axes
* **X-axis:** Dimension (log scale). Axis markers are at 4 x 10^1, 6 x 10^1, 10^2, and 2 x 10^2.
* **Y-axis:** Gradient updates (log scale). Axis markers are at 10^2 and 10^3.
* **Legend (top-left):**
* Blue dashed line: Linear fit: slope = 1.2884
* Green dashed line: Linear fit: slope = 1.3823
* Red dashed line: Linear fit: slope = 1.5535
* Blue circle with error bars: ε* = 0.008
* Green square with error bars: ε* = 0.01
* Red triangle with error bars: ε* = 0.012
### Detailed Analysis
* **ε* = 0.008 (Blue):**
* Trend: The data points generally slope upward.
* Data points (approximate):
* Dimension = 40, Gradient updates = 150 +/- 20
* Dimension = 60, Gradient updates = 250 +/- 20
* Dimension = 100, Gradient updates = 500 +/- 50
* Dimension = 200, Gradient updates = 1000 +/- 50
* **ε* = 0.01 (Green):**
* Trend: The data points generally slope upward.
* Data points (approximate):
* Dimension = 40, Gradient updates = 130 +/- 20
* Dimension = 60, Gradient updates = 280 +/- 30
* Dimension = 100, Gradient updates = 550 +/- 50
* Dimension = 200, Gradient updates = 1100 +/- 100
* **ε* = 0.012 (Red):**
* Trend: The data points generally slope upward.
* Data points (approximate):
* Dimension = 40, Gradient updates = 110 +/- 20
* Dimension = 60, Gradient updates = 230 +/- 30
* Dimension = 100, Gradient updates = 500 +/- 50
* Dimension = 200, Gradient updates = 1200 +/- 150
### Key Observations
* All three data series (ε* = 0.008, 0.01, and 0.012) show a positive correlation between dimension and gradient updates. As the dimension increases, the number of gradient updates also increases.
* The linear fits indicate that the relationship is approximately linear on a log-log scale, suggesting a power-law relationship between dimension and gradient updates.
* The slope of the linear fit increases with increasing ε* value. This means that the rate of increase in gradient updates with respect to dimension is higher for larger values of ε*.
* The error bars suggest some variability in the gradient updates for each dimension, but the overall trend is clear.
### Interpretation
The plot demonstrates that the number of gradient updates required increases with the dimension of the problem. Furthermore, the parameter ε* influences the rate at which gradient updates increase with dimension. A higher ε* value leads to a steeper increase in gradient updates as the dimension grows. This suggests that for higher-dimensional problems, a larger ε* might lead to faster convergence, but at the cost of potentially requiring more gradient updates. The power-law relationship indicated by the linear fits on the log-log scale implies that the computational cost of training increases significantly with the dimension of the problem, especially for larger ε* values. The error bars indicate that there is some variance in the number of gradient updates required, which could be due to factors such as the specific dataset or the initialization of the model.