## Chart: Gradient Updates vs. Dimension (Log Scale)
### Overview
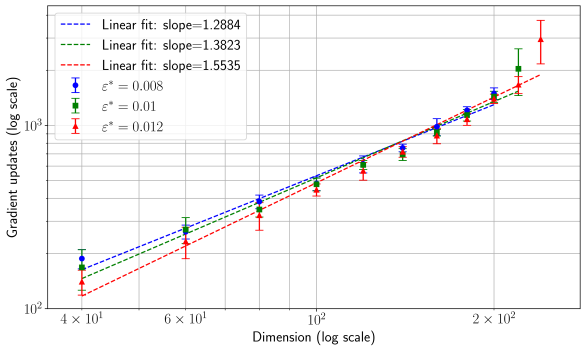
The image presents a chart illustrating the relationship between gradient updates (on a logarithmic scale) and dimension (also on a logarithmic scale). Three different lines are plotted, each representing a different value of epsilon (ε*), with error bars indicating uncertainty. Linear fits are shown for each line, with their respective slopes provided.
### Components/Axes
* **X-axis:** Dimension (log scale), ranging from approximately 4 x 10¹ to 2 x 10². Axis markers are at 40, 60, 100, and 200.
* **Y-axis:** Gradient updates (log scale), ranging from approximately 10² to 10⁴. Axis markers are at 100, 1000, and 10000.
* **Legend:** Located in the top-left corner.
* Blue dashed line: Linear fit: slope = 1.2884, ε* = 0.008
* Green dashed-dotted line: Linear fit: slope = 1.3823, ε* = 0.01
* Red dashed-dotted line: Linear fit: slope = 1.5535, ε* = 0.012
* **Data Points:** Each line consists of approximately 7 data points, each with associated error bars (vertical lines).
### Detailed Analysis
Let's analyze each data series individually:
**1. Blue Line (ε* = 0.008):**
* Trend: The blue line slopes upward, indicating a positive correlation between dimension and gradient updates. The slope of the linear fit is 1.2884.
* Data Points (approximate, reading from the chart):
* Dimension = 40: Gradient Updates = 250 (± 50)
* Dimension = 60: Gradient Updates = 350 (± 60)
* Dimension = 100: Gradient Updates = 600 (± 80)
* Dimension = 200: Gradient Updates = 1200 (± 150)
**2. Green Line (ε* = 0.01):**
* Trend: The green line also slopes upward, with a steeper slope than the blue line. The slope of the linear fit is 1.3823.
* Data Points (approximate):
* Dimension = 40: Gradient Updates = 300 (± 60)
* Dimension = 60: Gradient Updates = 450 (± 70)
* Dimension = 100: Gradient Updates = 750 (± 100)
* Dimension = 200: Gradient Updates = 1500 (± 200)
**3. Red Line (ε* = 0.012):**
* Trend: The red line exhibits an upward slope, and is the steepest of the three lines. The slope of the linear fit is 1.5535.
* Data Points (approximate):
* Dimension = 40: Gradient Updates = 350 (± 70)
* Dimension = 60: Gradient Updates = 500 (± 80)
* Dimension = 100: Gradient Updates = 850 (± 120)
* Dimension = 200: Gradient Updates = 1700 (± 250)
### Key Observations
* All three lines demonstrate a positive correlation between dimension and gradient updates.
* As ε* increases, the slope of the linear fit also increases, indicating a faster rate of gradient updates with increasing dimension.
* The error bars suggest a significant degree of uncertainty in the gradient update measurements, particularly at higher dimensions.
* The lines are roughly parallel, suggesting a consistent relationship between dimension and gradient updates across different values of ε*.
### Interpretation
The chart suggests that the number of gradient updates required for optimization increases with the dimensionality of the problem. The rate of increase is influenced by the value of ε*. A larger ε* leads to a faster increase in gradient updates as the dimension grows. This could be related to the curvature of the loss landscape, where higher dimensions might require more steps to navigate effectively. The linear fits imply that the relationship between gradient updates and dimension is approximately linear within the observed range. The error bars highlight the inherent variability in the optimization process, and the need for caution when interpreting the results. The chart provides insights into the scaling behavior of gradient-based optimization algorithms in high-dimensional spaces, which is crucial for designing efficient machine learning models.