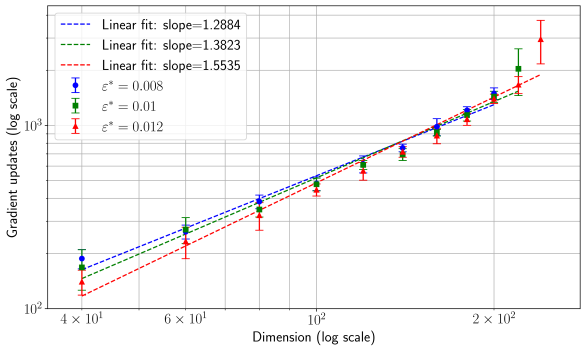
## Line Graph: Gradient Updates vs. Dimension
### Overview
The image is a log-log line graph comparing gradient updates (y-axis) across different dimensions (x-axis). Three linear fits with distinct slopes are plotted alongside three data series labeled by ε* values (0.008, 0.01, 0.012). Each data series includes error bars, and the lines are color-coded to match their corresponding ε* values.
---
### Components/Axes
- **X-axis (Dimension)**: Logarithmic scale ranging from $4 \times 10^1$ to $2 \times 10^2$. Tick labels: $4 \times 10^1$, $6 \times 10^1$, $10^2$, $2 \times 10^2$.
- **Y-axis (Gradient Updates)**: Logarithmic scale from $10^2$ to $10^3$. Tick labels: $10^2$, $10^3$.
- **Legend**: Located in the top-left corner. Contains:
- Blue dashed line: Slope = 1.2884 (ε* = 0.008).
- Green dash-dot line: Slope = 1.3823 (ε* = 0.01).
- Red dashed line: Slope = 1.5535 (ε* = 0.012).
- **Data Points**: Three series with error bars, color-coded to match the legend. Positions:
- ε* = 0.008 (blue): Points at $4 \times 10^1$, $6 \times 10^1$, $10^2$, $2 \times 10^2$ dimensions.
- ε* = 0.01 (green): Points at $6 \times 10^1$, $10^2$, $2 \times 10^2$.
- ε* = 0.012 (red): Points at $10^2$, $2 \times 10^2$.
---
### Detailed Analysis
1. **Linear Fits**:
- Blue line (slope = 1.2884): Starts near $10^2$ gradient updates at $4 \times 10^1$ dimension, ending near $10^3$ at $2 \times 10^2$.
- Green line (slope = 1.3823): Begins slightly above the blue line at $6 \times 10^1$, ending above it at $2 \times 10^2$.
- Red line (slope = 1.5535): Steepest slope, starting near $10^2$ at $10^2$ dimension and reaching ~$10^3$ at $2 \times 10^2$.
2. **Data Points**:
- All series show increasing gradient updates with dimension.
- Error bars vary: Largest for ε* = 0.012 (red) at $2 \times 10^2$, smallest for ε* = 0.008 (blue) at $4 \times 10^1$.
3. **Legend Consistency**:
- Colors and markers match legend entries exactly. For example, red dashed line corresponds to ε* = 0.012 data points.
---
### Key Observations
- **Trend Verification**:
- All lines slope upward, confirming a positive correlation between dimension and gradient updates.
- Red line (highest slope) increases fastest, followed by green, then blue.
- **Outliers/Anomalies**:
- No clear outliers; data points align closely with their respective lines.
- Error bars suggest higher uncertainty for larger dimensions and larger ε* values.
---
### Interpretation
The graph demonstrates a power-law relationship between dimension and gradient updates, with the exponent (slope) increasing as ε* rises. This implies:
- **Higher ε* values** (e.g., 0.012) result in steeper growth in gradient updates as dimension increases.
- The logarithmic scales emphasize multiplicative trends, suggesting exponential scaling in linear space.
- Error bars indicate that measurements for larger dimensions and ε* values are less precise, possibly due to computational or experimental constraints.
The data supports the hypothesis that gradient updates scale polynomially with dimension, modulated by the ε* parameter. This could reflect trade-offs in optimization algorithms or hyperparameter sensitivity in machine learning models.