# Technical Data Extraction: Network Traffic Flow Analysis
## 1. Document Metadata
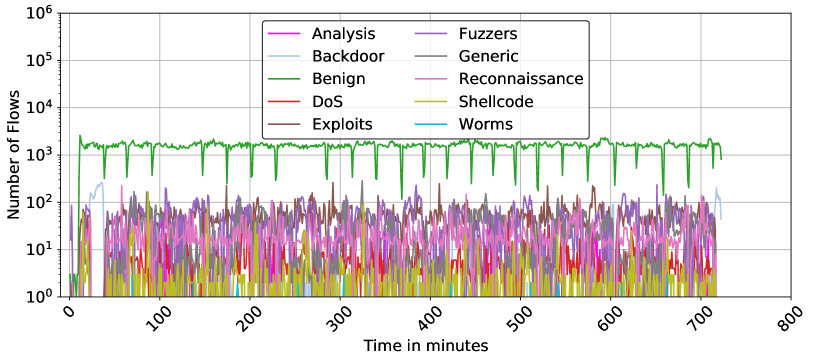
* **Image Type:** Line Graph (Time-series)
* **Primary Language:** English
* **Subject Matter:** Cybersecurity / Network Traffic Analysis (Number of Flows over Time)
* **Scale:** Logarithmic (Y-axis)
## 2. Axis and Legend Extraction
### Axis Labels
* **Y-Axis (Vertical):** "Number of Flows"
* **Scale:** Logarithmic base 10.
* **Markers:** $10^0$ (1), $10^1$ (10), $10^2$ (100), $10^3$ (1,000), $10^4$ (10,000), $10^5$ (100,000), $10^6$ (1,000,000).
* **X-Axis (Horizontal):** "Time in minutes"
* **Scale:** Linear.
* **Markers:** 0, 100, 200, 300, 400, 500, 600, 700, 800.
### Legend (Spatial Placement: Top-Center [x≈0.5, y≈0.8])
The legend contains 10 categories of network traffic, organized in two columns:
| Color | Category | Color | Category |
| :--- | :--- | :--- | :--- |
| Magenta | Analysis | Purple | Fuzzers |
| Light Blue | Backdoor | Grey | Generic |
| Green | Benign | Pink | Reconnaissance |
| Red | DoS | Yellow-Gold | Shellcode |
| Brown | Exploits | Cyan | Worms |
---
## 3. Component Isolation & Trend Analysis
### Region A: High-Volume Baseline (Green Line)
* **Category:** Benign
* **Visual Trend:** This is the dominant series. It maintains a relatively stable horizontal plateau between $10^3$ and $2 \times 10^3$ flows. It is characterized by periodic, sharp downward spikes (dips) occurring approximately every 40–50 minutes, where traffic drops briefly to the $10^2$ range before recovering.
* **Data Range:** ~200 to ~2,200 flows.
### Region B: Mid-Volume Attack Traffic ($10^1$ to $10^2$ range)
* **Categories:** Fuzzers (Purple), Exploits (Brown), Generic (Grey), Reconnaissance (Pink).
* **Visual Trend:** These series exhibit high volatility (jitter) but stay consistently within the $10^1$ and $2 \times 10^2$ band.
* **Fuzzers (Purple):** Shows frequent peaks reaching near $2 \times 10^2$.
* **Exploits (Brown):** Intermittent bursts, often overlapping with Fuzzers.
* **Backdoor (Light Blue):** Shows a distinct early peak (around minute 20-40) reaching above $10^2$, then drops off, reappearing briefly at the very end of the timeline (minute 700+).
### Region C: Low-Volume / Sparse Traffic ($10^0$ to $10^1$ range)
* **Categories:** DoS (Red), Shellcode (Yellow-Gold), Analysis (Magenta), Worms (Cyan).
* **Visual Trend:** These categories are often at the baseline ($10^0$) or non-existent for long periods.
* **Shellcode (Yellow):** Frequent small spikes but rarely exceeds 10 flows.
* **DoS (Red):** Very sparse, appearing as isolated spikes.
* **Worms (Cyan):** The least frequent; only a few visible pixels/spikes across the 800-minute span.
---
## 4. Key Data Observations
1. **Temporal Scope:** The data tracks network activity for approximately 720 minutes (12 hours).
2. **Class Imbalance:** There is a clear 1-2 order of magnitude difference between "Benign" traffic and the most active "Attack" traffic (Fuzzers/Exploits).
3. **Periodic Behavior:** The "Benign" traffic (Green) shows a highly regular heartbeat-like pattern of dips, suggesting a scheduled system process or a periodic reset in the data collection mechanism.
4. **Attack Synchronization:** Many attack types (Fuzzers, Exploits, Reconnaissance) appear to be active simultaneously throughout the duration of the capture, creating a "noise floor" of malicious activity between 10 and 100 flows.
5. **Specific Event:** A unique "Backdoor" (Light Blue) event occurs early in the timeline (approx. minute 10 to 40), which is the only time that specific category dominates the sub-$10^3$ space.