# Technical Document Extraction: Line Chart Analysis
## 1. Labels and Axis Titles
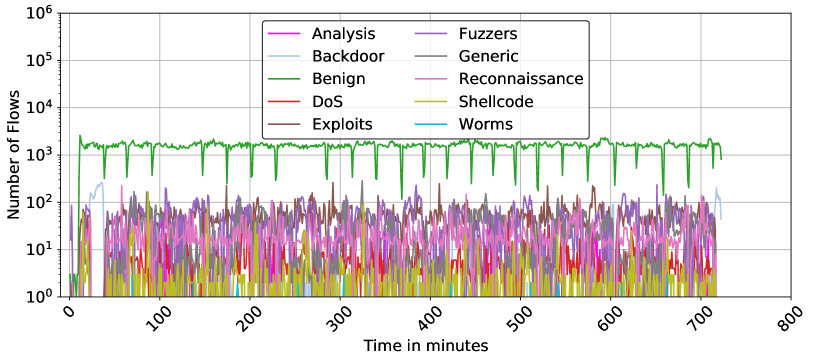
- **Y-Axis**: "Number of Flows" (logarithmic scale, 10⁰ to 10⁶)
- **X-Axis**: "Time in minutes" (0 to 800)
- **Legend**: Located in the top-right corner, with color-coded categories.
## 2. Legend Categories and Colors
| Category | Color |
|------------------|-----------|
| Analysis | Pink |
| Fuzzers | Purple |
| Backdoor | Blue |
| Generic | Brown |
| Benign | Green |
| Reconnaissance | Red |
| DoS | Yellow |
| Shellcode | Light Blue|
| Exploits | Dark Red |
| Worms | Cyan |
## 3. Key Trends and Data Points
### 3.1 Benign (Green Line)
- **Trend**: Dominates the chart with a stable baseline of ~10³ to 10⁴ flows.
- **Spikes**: Periodic sharp drops to ~10² flows, recurring every ~50–100 minutes.
- **Peaks**: Sustained high values (10⁴–10⁵) between spikes.
### 3.2 Other Categories (Analysis, Fuzzers, etc.)
- **Trend**: All lines (pink, purple, blue, brown, red, yellow, light blue, dark red, cyan) fluctuate between ~10¹ and 10³ flows.
- **Variability**: No consistent patterns; erratic spikes and drops.
- **Overlap**: Multiple categories often intersect, with no single line dominating.
## 4. Spatial Grounding
- **Legend Position**: Top-right corner (coordinates: [x=700, y=100] relative to chart boundaries).
- **Color Consistency**: All lines match their legend labels (e.g., green = Benign, pink = Analysis).
## 5. Trend Verification
- **Benign Line**: Slopes upward slightly over time, with periodic dips.
- **Other Lines**: No clear upward/downward trends; chaotic fluctuations.
## 6. Component Isolation
- **Header**: Legend (top-right).
- **Main Chart**: Line graph with logarithmic y-axis and linear x-axis.
- **Footer**: No additional components.
## 7. Data Table Reconstruction
No explicit data table present. Trends inferred from visual patterns.
## 8. Language and Text
- **Primary Language**: English.
- **Transcribed Text**: All labels, axis titles, and legend entries are in English.
## 9. Critical Observations
- **Dominance of Benign Flows**: Green line consistently exceeds other categories by orders of magnitude.
- **Anomalies**: Sharp drops in Benign flows suggest potential misclassification or external events.
- **Low-Volume Categories**: Analysis, Fuzzers, and Reconnaissance show minimal activity compared to Benign.
## 10. Conclusion
The chart illustrates a high-volume, stable "Benign" flow category with intermittent anomalies, while other categories exhibit low, erratic activity. No explicit numerical data points are provided; trends are derived from visual inspection.