# Technical Document Extraction: Attention Key QueryScore Graph
## Title
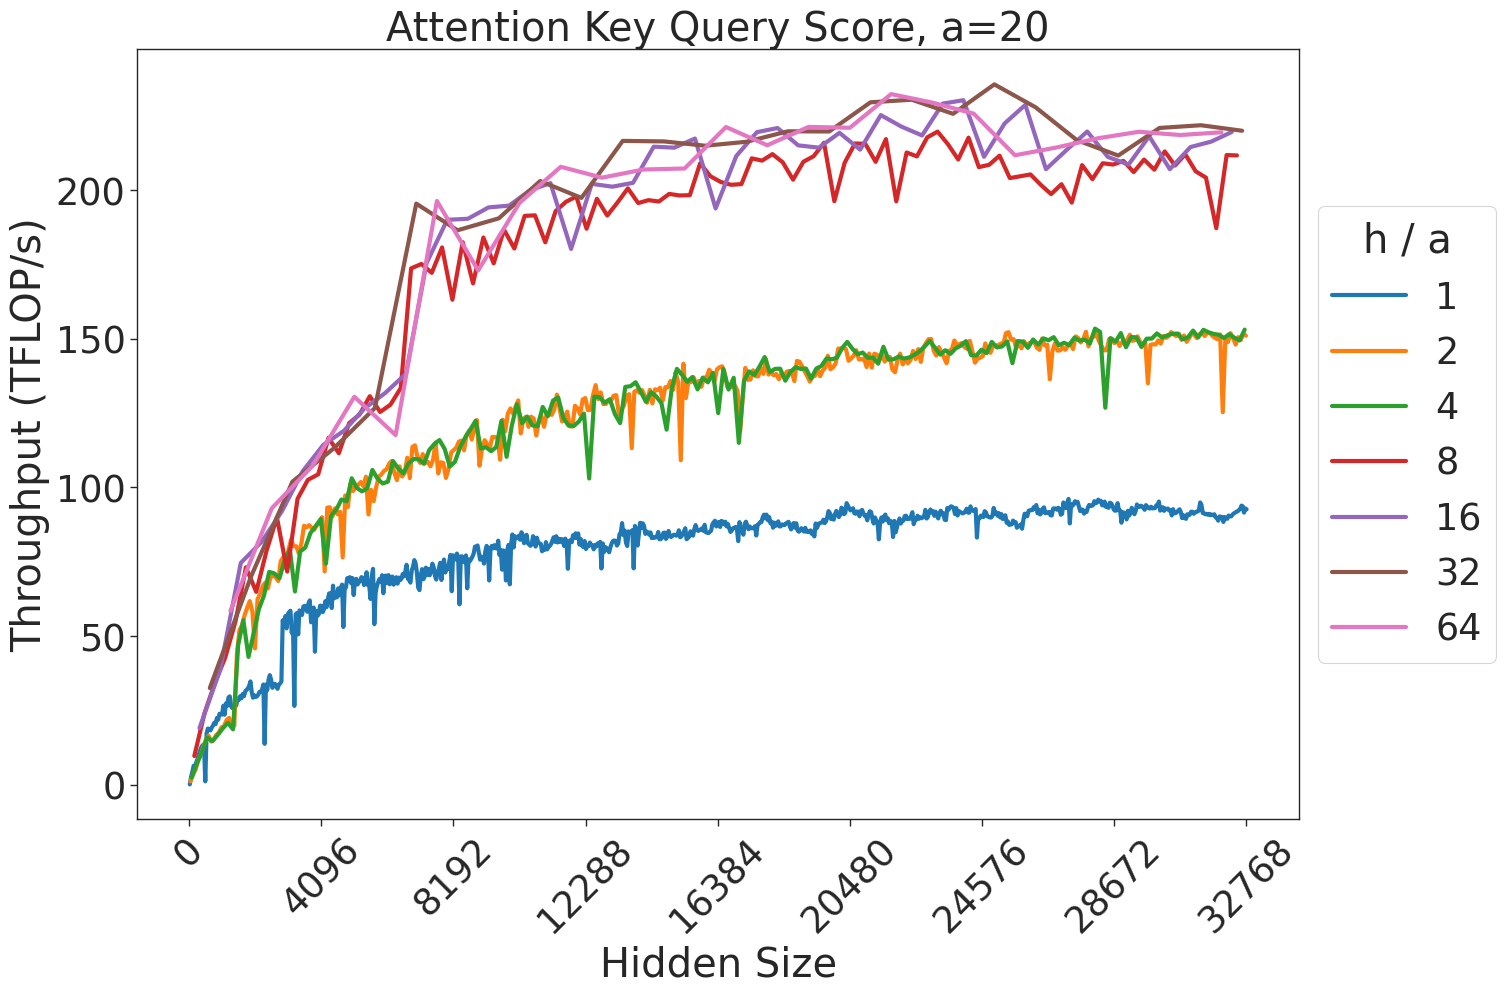
**Attention Key Query Score, a=20**
## Axes
- **X-axis**: Hidden Size (values: 0, 4096, 8192, 12288, 16384, 20480, 24576, 28672, 32768)
- **Y-axis**: Throughput (TFLOPs/s) (values: 0, 50, 100, 150, 200)
## Legend
- **Position**: Right side of the plot (outside the graph area)
- **Labels and Colors**:
- `h/a = 1` (blue)
- `h/a = 2` (orange)
- `h/a = 4` (green)
- `h/a = 8` (red)
- `h/a = 16` (purple)
- `h/a = 32` (brown)
- `h/a = 64` (pink)
## Data Trends
1. **h/a = 1 (blue)**:
- **Trend**: Gentle upward slope, lowest throughput across all hidden sizes.
- **Key Points**: Starts at 0, reaches ~90 TFLOPs/s at hidden size 32768.
2. **h/a = 2 (orange)**:
- **Trend**: Moderate upward slope, surpasses h/a=1 but remains below h/a=4.
- **Key Points**: Starts at 0, reaches ~140 TFLOPs/s at hidden size 32768.
3. **h/a = 4 (green)**:
- **Trend**: Steeper slope than h/a=2, consistent growth.
- **Key Points**: Starts at 0, reaches ~150 TFLOPs/s at hidden size 32768.
4. **h/a = 8 (red)**:
- **Trend**: Sharp upward slope, surpasses h/a=4 significantly.
- **Key Points**: Starts at 0, reaches ~200 TFLOPs/s at hidden size 32768.
5. **h/a = 16 (purple)**:
- **Trend**: Very steep slope, highest throughput until h/a=32.
- **Key Points**: Starts at 0, peaks at ~220 TFLOPs/s near hidden size 24576, then plateaus.
6. **h/a = 32 (brown)**:
- **Trend**: Slightly less steep than h/a=16, but maintains high throughput.
- **Key Points**: Starts at 0, peaks at ~220 TFLOPs/s near hidden size 24576, then plateaus.
7. **h/a = 64 (pink)**:
- **Trend**: Steepest slope, highest throughput overall.
- **Key Points**: Starts at 0, peaks at ~220 TFLOPs/s near hidden size 24576, then plateaus.
## Key Observations
- **Correlation**: Higher `h/a` ratios correspond to higher throughput, especially at larger hidden sizes.
- **Plateaus**: All lines plateau near hidden size 24576–32768, indicating diminishing returns beyond this point.
- **Divergence**: Lines for h/a=16, 32, and 64 overlap significantly in the plateau region, suggesting similar performance limits.
## Spatial Grounding
- **Legend**: Right-aligned, outside the plot area. Colors match line colors exactly (e.g., blue = h/a=1).
- **Data Points**: All lines originate at (0, 0) and increase monotonically with hidden size.
## Conclusion
The graph demonstrates that increasing the `h/a` ratio improves throughput, with diminishing returns observed at larger hidden sizes. The highest performance is achieved with `h/a=64`, though all high-ratio lines converge near the plateau region.