## Flowchart Diagram: Process Flow with Transformations
### Overview
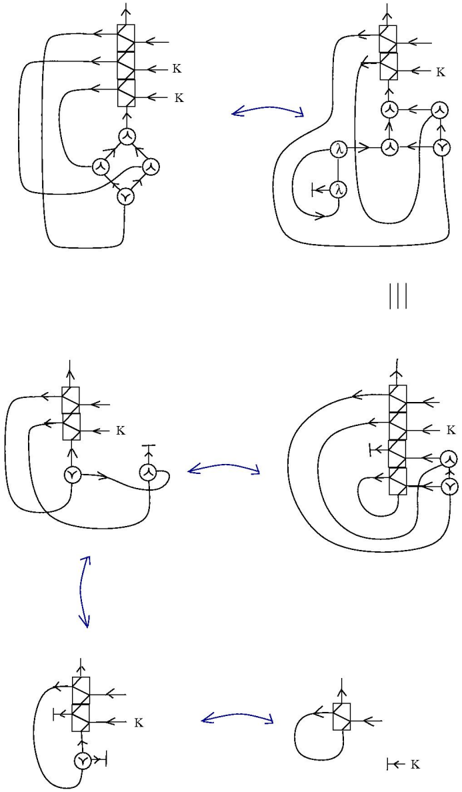
The image depicts a multi-stage flowchart with interconnected components and directional arrows. It consists of three primary diagrams (labeled I, II, III) connected by blue arrows indicating transformations or sequential steps. Each diagram contains geometric shapes (rectangles, circles) labeled with symbols (K, Y, λ) and directional arrows showing data or process flow.
### Components/Axes
- **Symbols**:
- **K**: Rectangle with diagonal crosshatch (appears in all diagrams, positioned at the top).
- **Y**: Circle with checkmark (appears in all diagrams, positioned at the bottom).
- **λ**: Circle with horizontal line (appears in diagrams II and III, positioned in the middle).
- **Arrows**:
- **Black arrows**: Indicate primary flow direction within each diagram.
- **Blue arrows**: Connect diagrams I → II → III, suggesting sequential transformations.
- **Labels**:
- Vertical line labeled "III" separates diagrams II and III.
- No explicit axis titles or numerical scales present.
### Detailed Analysis
1. **Diagram I**:
- **Structure**:
- K (top) → Y (bottom) via two parallel black arrows.
- Y connects to three λ nodes via bidirectional arrows.
- λ nodes form a triangular feedback loop.
- **Flow**: Input (K) splits into two paths to Y, which then distributes to λ nodes in a cyclic manner.
2. **Diagram II**:
- **Structure**:
- K (top) → Y (bottom) via a single black arrow.
- Y connects to λ via a bidirectional arrow.
- λ loops back to K via a blue arrow.
- **Flow**: Linear path from K to Y, with λ acting as a feedback mechanism to K.
3. **Diagram III**:
- **Structure**:
- K (top) → Y (bottom) via a single black arrow.
- Y connects to λ via a unidirectional arrow.
- λ loops back to K via a black arrow.
- **Flow**: Simplified feedback loop compared to Diagram II, with λ directly returning to K.
### Key Observations
- **Consistency**: K and Y are constant across all diagrams, suggesting they represent fixed input/output nodes.
- **Feedback Complexity**: Diagrams I and II show increasingly complex feedback loops involving λ, while Diagram III simplifies the loop.
- **Blue Arrows**: Indicate transformations between diagrams, possibly representing iterative refinement or process evolution.
- **Symbol Roles**:
- **K**: Likely a "key" or "control" component (rectangle with crosshatch).
- **Y**: Likely a "yes" or "output" node (checkmark symbol).
- **λ**: Likely a "lambda" transformation or intermediate step (horizontal line).
### Interpretation
The flowchart illustrates a multi-stage process with iterative feedback and transformation steps. Diagram I represents the most complex system, with distributed feedback among λ nodes. Diagrams II and III simplify the feedback mechanism, suggesting optimization or reduction in complexity. The blue arrows imply that each subsequent diagram (I→II→III) represents a refined or evolved version of the process. The use of K (control), Y (output), and λ (transformation) aligns with common technical notation for system diagrams, where feedback loops are critical for stability or adaptation. The absence of numerical data suggests this is a conceptual model rather than a quantitative analysis.