## Diagram: Distributed Graph Processing Pipeline
### Overview
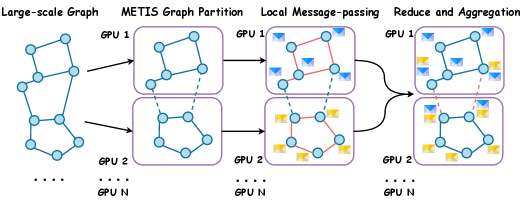
The image illustrates a distributed graph processing pipeline, showing how a large-scale graph is partitioned and processed across multiple GPUs. The pipeline consists of four stages: Large-scale Graph, METIS Graph Partition, Local Message-passing, and Reduce and Aggregation. The graph is initially partitioned using METIS, and each partition is assigned to a GPU. Local message-passing occurs within each GPU, and finally, the results are aggregated across all GPUs.
### Components/Axes
* **Stages (Top):**
* Large-scale Graph
* METIS Graph Partition
* Local Message-passing
* Reduce and Aggregation
* **GPUs (Left):** GPU 1, GPU 2, ..., GPU N. These labels indicate that the process is distributed across multiple GPUs, from GPU 1 to GPU N.
* **Graph Representation:** The graph is represented as nodes (blue circles) connected by edges (lines).
* **Messages:** Messages are represented as envelope icons, colored blue and yellow.
* **Partition Boundaries:** Dashed lines indicate partition boundaries between GPUs.
### Detailed Analysis
1. **Large-scale Graph:**
* A complex graph structure is shown on the left. It consists of approximately 12 nodes connected by edges.
* The graph is not partitioned at this stage.
* Below the graph, the label "GPU N" is present, with ellipsis (...) indicating that there are multiple GPUs involved in the process.
2. **METIS Graph Partition:**
* The large-scale graph is partitioned into two subgraphs.
* GPU 1 contains one partition, and GPU 2 contains the other.
* A dashed line connects nodes between the two partitions, indicating inter-GPU communication.
* The partitions appear to be roughly equal in size, with each containing approximately 6 nodes.
3. **Local Message-passing:**
* Within each GPU, nodes exchange messages (represented by envelope icons).
* Red lines indicate the paths of message passing between nodes within each partition.
* GPU 1 and GPU 2 each have several messages being passed between their nodes.
4. **Reduce and Aggregation:**
* The results from each GPU are aggregated.
* Messages are exchanged between the GPUs to combine the results. This is indicated by the dashed red line between the two GPU partitions.
* The final graph structure in each GPU reflects the aggregated results.
* The number of messages (envelope icons) appears to be reduced compared to the previous stage.
### Key Observations
* The diagram illustrates a common pattern in distributed graph processing: partitioning, local computation, and aggregation.
* The use of METIS suggests an attempt to balance the workload across GPUs and minimize inter-GPU communication.
* Message-passing is a key component of the pipeline, enabling nodes within and across GPUs to exchange information.
### Interpretation
The diagram demonstrates a distributed graph processing pipeline designed to handle large-scale graphs by partitioning them across multiple GPUs. The METIS graph partition aims to optimize the distribution of the graph, while local message-passing allows for efficient computation within each GPU. The final reduce and aggregation step combines the results from each GPU to produce a global result. This approach is commonly used in graph analytics and machine learning applications where the graph is too large to fit into the memory of a single machine. The diagram highlights the importance of minimizing inter-GPU communication to improve performance.