\n
## Diagram: Graph Partitioning and Distributed Processing
### Overview
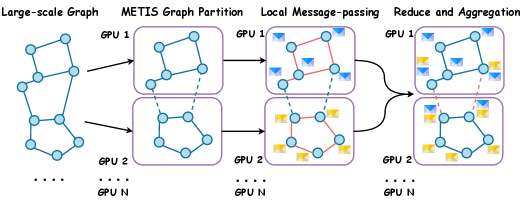
The image depicts a diagram illustrating a process for partitioning a large-scale graph and distributing its processing across multiple GPUs. The process involves four stages: starting with a large-scale graph, partitioning it using METIS, performing local message-passing, and finally reducing and aggregating the results. The diagram shows how the graph is split and processed on GPU 1 and GPU 2, with an indication that this can be extended to GPU N.
### Components/Axes
The diagram is organized into four columns, each representing a stage in the process. Each stage is labeled at the top. The GPUs are labeled "GPU 1", "GPU 2", and "GPU N" at the bottom of each column. The graph nodes are represented by light blue circles. Edges are represented by lines. In the "Local Message-passing" stage, edges are colored red and orange to indicate the direction of message passing. Small squares in the "Reduce and Aggregation" stage represent aggregated values. Arrows indicate the flow of data between stages.
### Detailed Analysis or Content Details
**Stage 1: Large-scale Graph**
- A single graph is shown, consisting of approximately 10 nodes connected by edges.
- The graph is not fully connected, with some nodes having fewer connections than others.
**Stage 2: METIS Graph Partition**
- The large-scale graph is partitioned into two subgraphs.
- The top subgraph is assigned to GPU 1, and the bottom subgraph is assigned to GPU 2.
- The partitioning appears to attempt to minimize the number of edges cut between the two subgraphs.
- Each subgraph contains approximately 5 nodes.
**Stage 3: Local Message-passing**
- Each subgraph on GPU 1 and GPU 2 now has edges colored red and orange.
- Red edges appear to represent messages being sent from one node to another within the same subgraph.
- Orange edges appear to represent messages being sent between nodes in different subgraphs.
- GPU 1 has approximately 3 red edges and 1 orange edge.
- GPU 2 has approximately 4 red edges and 1 orange edge.
**Stage 4: Reduce and Aggregation**
- Each subgraph on GPU 1 and GPU 2 now has small squares (approximately 4) placed on some nodes.
- These squares likely represent aggregated values computed from the local message-passing step.
- The squares are colored light blue and orange.
- GPU 1 has 2 light blue squares and 2 orange squares.
- GPU 2 has 2 light blue squares and 2 orange squares.
- Arrows indicate that the aggregated values are being combined.
### Key Observations
- The diagram illustrates a distributed graph processing approach.
- The METIS partitioning step is crucial for dividing the graph across multiple GPUs.
- Local message-passing allows nodes within each subgraph to exchange information.
- The reduce and aggregation step combines the local results to produce a global result.
- The diagram suggests that the process can be scaled to an arbitrary number of GPUs (GPU N).
### Interpretation
The diagram demonstrates a common strategy for processing large graphs that exceed the memory capacity of a single machine. By partitioning the graph and distributing the computation across multiple GPUs, the overall processing time can be significantly reduced. The use of METIS suggests an attempt to minimize communication overhead by reducing the number of edges that need to be transferred between GPUs. The message-passing and aggregation steps are typical components of distributed graph algorithms, such as PageRank or graph neural networks. The diagram is a high-level illustration of the process and does not provide specific details about the algorithm or implementation. The color coding of edges in the message-passing stage is important for understanding the flow of information between nodes and GPUs. The squares in the final stage represent the result of local computations, which are then aggregated to produce a global result. The diagram is a conceptual representation and does not include any numerical data or performance metrics.