## Bar Chart: Attack Success Rate with and without Guard
### Overview
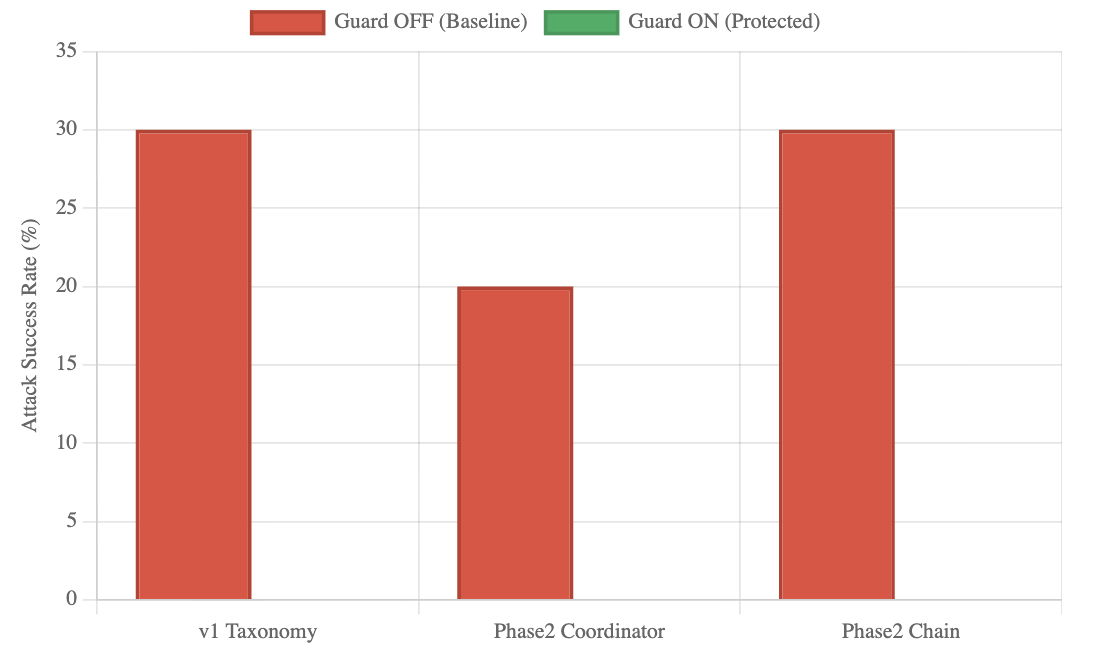
The image is a bar chart comparing the attack success rate (%) for three different categories: "v1 Taxonomy", "Phase2 Coordinator", and "Phase2 Chain". The chart shows the attack success rate when the "Guard" is OFF (Baseline) and when the "Guard" is ON (Protected). The y-axis represents the "Attack Success Rate (%)", ranging from 0 to 35. The x-axis represents the three categories.
### Components/Axes
* **Title:** There is no explicit title on the chart.
* **X-axis:**
* Label: Categories - "v1 Taxonomy", "Phase2 Coordinator", "Phase2 Chain"
* **Y-axis:**
* Label: "Attack Success Rate (%)"
* Scale: 0, 5, 10, 15, 20, 25, 30, 35
* **Legend:** Located at the top of the chart.
* "Guard OFF (Baseline)" - Represented by a red bar.
* "Guard ON (Protected)" - Represented by a green bar. (Note: There are no green bars in the image, so this data is missing.)
### Detailed Analysis
The chart only displays data for "Guard OFF (Baseline)" represented by red bars.
* **v1 Taxonomy:** The attack success rate is approximately 30%.
* **Phase2 Coordinator:** The attack success rate is approximately 20%.
* **Phase2 Chain:** The attack success rate is approximately 30%.
### Key Observations
* The attack success rate is highest for "v1 Taxonomy" and "Phase2 Chain" when the Guard is OFF (Baseline).
* The attack success rate is lowest for "Phase2 Coordinator" when the Guard is OFF (Baseline).
* There is no data provided for when the "Guard" is ON (Protected).
### Interpretation
The chart suggests that the "Phase2 Coordinator" is more resilient to attacks compared to "v1 Taxonomy" and "Phase2 Chain" when the Guard is OFF (Baseline). However, the absence of data for "Guard ON (Protected)" makes it impossible to assess the effectiveness of the "Guard" in mitigating attacks for each category. The data implies that the "Guard" feature is intended to reduce the attack success rate, but without the corresponding data, this cannot be confirmed.