\n
## Bar Chart: Attack Success Rate with and without Guard
### Overview
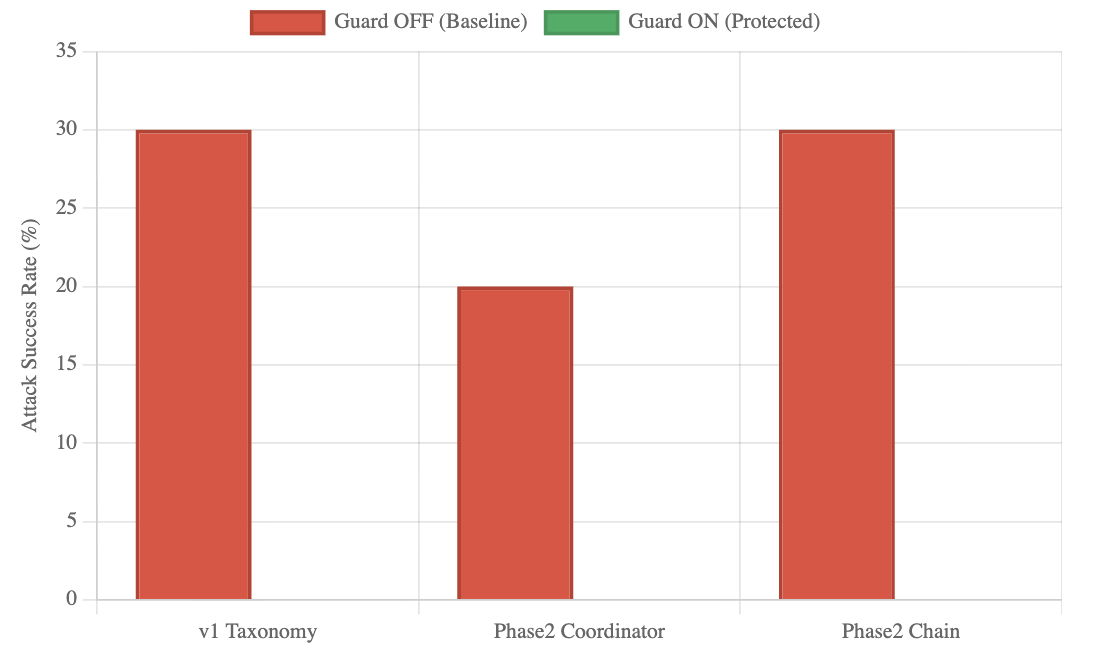
This bar chart compares the attack success rate (%) for three different attack strategies (v1 Taxonomy, Phase2 Coordinator, Phase2 Chain) under two conditions: Guard OFF (Baseline) and Guard ON (Protected). The chart visually represents the impact of the "Guard" feature on the success rate of each attack strategy.
### Components/Axes
* **X-axis:** Attack Strategy - Categories: v1 Taxonomy, Phase2 Coordinator, Phase2 Chain.
* **Y-axis:** Attack Success Rate (%) - Scale: 0 to 35, with increments of 5.
* **Legend:**
* Red Bar: Guard OFF (Baseline)
* Green Bar: Guard ON (Protected)
* The legend is positioned at the top-right of the chart.
### Detailed Analysis
The chart consists of six bars, representing the attack success rate for each strategy under both Guard conditions.
* **v1 Taxonomy:**
* Guard OFF (Red): Approximately 29-30%. The bar reaches slightly below the 30% mark.
* Guard ON (Green): No bar is present for Guard ON.
* **Phase2 Coordinator:**
* Guard OFF (Red): Approximately 20%. The bar reaches the 20% mark.
* Guard ON (Green): No bar is present for Guard ON.
* **Phase2 Chain:**
* Guard OFF (Red): Approximately 30%. The bar reaches the 30% mark.
* Guard ON (Green): No bar is present for Guard ON.
### Key Observations
* The "Guard ON" (Green) bars are entirely absent, indicating that the Guard feature was not tested or did not yield any successful attacks for any of the strategies.
* The "v1 Taxonomy" and "Phase2 Chain" strategies have similar attack success rates when the Guard is OFF (approximately 30%).
* The "Phase2 Coordinator" strategy has a significantly lower attack success rate when the Guard is OFF (approximately 20%) compared to the other two strategies.
### Interpretation
The data suggests that the "Guard" feature, in its current implementation, completely prevents successful attacks across all tested strategies. This could indicate a highly effective security measure, or it could suggest that the testing methodology did not adequately explore potential bypasses or vulnerabilities. The significant difference in attack success rate for the "Phase2 Coordinator" strategy when the Guard is OFF suggests that this strategy is inherently more vulnerable than the other two, making it a prime target for security enhancements. The absence of data for "Guard ON" is a critical point – further investigation is needed to understand why the Guard feature resulted in zero successful attacks. It's possible the Guard is blocking all attempts, or the testing methodology was flawed. The chart highlights the importance of testing security features under various attack scenarios to ensure comprehensive protection.