## Bar Chart: Attack Success Rate Comparison
### Overview
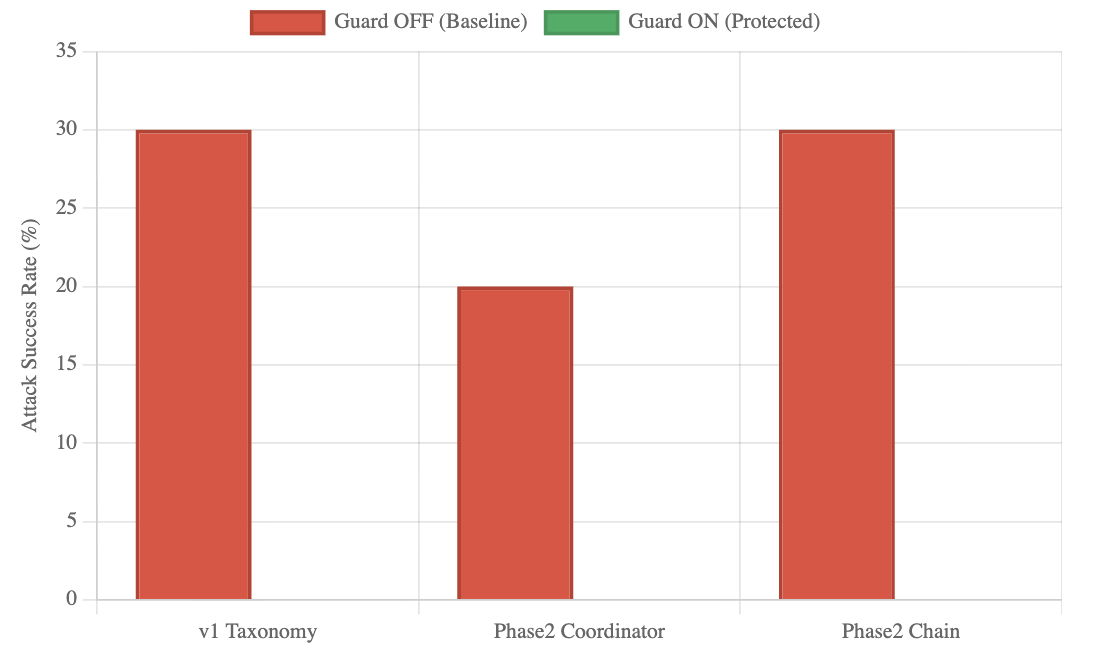
This is a vertical bar chart comparing the "Attack Success Rate (%)" across three different categories or systems under two conditions: "Guard OFF (Baseline)" and "Guard ON (Protected)". The chart visually presents the effectiveness of a protective "Guard" mechanism by showing the success rate of attacks when the guard is disabled versus when it is enabled.
### Components/Axes
* **Chart Type:** Vertical Bar Chart.
* **Y-Axis (Vertical):**
* **Label:** "Attack Success Rate (%)"
* **Scale:** Linear scale from 0 to 35, with major gridlines at intervals of 5 (0, 5, 10, 15, 20, 25, 30, 35).
* **X-Axis (Horizontal):**
* **Categories (from left to right):**
1. `v1 Taxonomy`
2. `Phase2 Coordinator`
3. `Phase2 Chain`
* **Legend:**
* **Position:** Centered at the top of the chart area.
* **Series 1:** A red rectangle labeled `Guard OFF (Baseline)`.
* **Series 2:** A green rectangle labeled `Guard ON (Protected)`.
* **Data Series:** The chart contains bars corresponding to the "Guard OFF (Baseline)" series (red). **No bars for the "Guard ON (Protected)" series (green) are visible in the provided image.**
### Detailed Analysis
The chart displays three red bars, representing the baseline attack success rate for each category when the guard is off.
1. **v1 Taxonomy:**
* **Visual Trend:** The bar is the tallest, reaching the 30% gridline.
* **Data Point:** Attack Success Rate ≈ **30%**.
2. **Phase2 Coordinator:**
* **Visual Trend:** The bar is shorter than the other two, aligning with the 20% gridline.
* **Data Point:** Attack Success Rate ≈ **20%**.
3. **Phase2 Chain:**
* **Visual Trend:** The bar is the same height as the "v1 Taxonomy" bar, reaching the 30% gridline.
* **Data Point:** Attack Success Rate ≈ **30%**.
**Critical Note on Missing Data:** The legend defines a second series, "Guard ON (Protected)" (green), but no green bars are plotted on the chart. This could indicate one of several possibilities: the attack success rate with the guard on is 0% for all categories, the data for this series is missing, or the chart is incomplete.
### Key Observations
* **Highest Vulnerability:** Both "v1 Taxonomy" and "Phase2 Chain" show the highest baseline vulnerability, with a 30% attack success rate.
* **Lowest Vulnerability:** "Phase2 Coordinator" shows a comparatively lower baseline vulnerability at 20%.
* **Missing Protected Data:** The most significant observation is the complete absence of data for the "Guard ON (Protected)" condition. This makes a direct comparison of the guard's effectiveness impossible from this visual alone.
* **Symmetry:** The baseline rates for the first and third categories are identical.
### Interpretation
This chart is designed to demonstrate the security posture of different system components or attack phases. The data suggests that without protection ("Guard OFF"), the "v1 Taxonomy" and "Phase2 Chain" components are equally susceptible to successful attacks, while the "Phase2 Coordinator" is somewhat more resilient.
The **critical investigative finding** is the lack of any plotted data for the "Guard ON" condition. A Peircean analysis would question the intent behind this presentation:
1. **Hypothesis 1 (Effectiveness):** If the guard is perfectly effective, the attack success rate would be 0%, which would be represented by bars at the baseline (0% on the y-axis). Their absence could be a stylistic choice to emphasize "zero" but is atypical for a bar chart.
2. **Hypothesis 2 (Data Omission):** The data for the protected condition may not have been collected, was unavailable, or was intentionally omitted, rendering the chart incomplete for its stated comparative purpose.
3. **Hypothesis 3 (Chart Error):** There may be a rendering or plotting error where the green bars were not generated.
Without the "Guard ON" data, the chart only tells half the story—it establishes a baseline problem but fails to visually demonstrate the solution's efficacy. To fully understand the guard's impact, the corresponding green data points are required. The chart, as presented, highlights vulnerability but does not validate protection.