# Technical Document Extraction: Attack Success Rate Analysis
## Chart Type
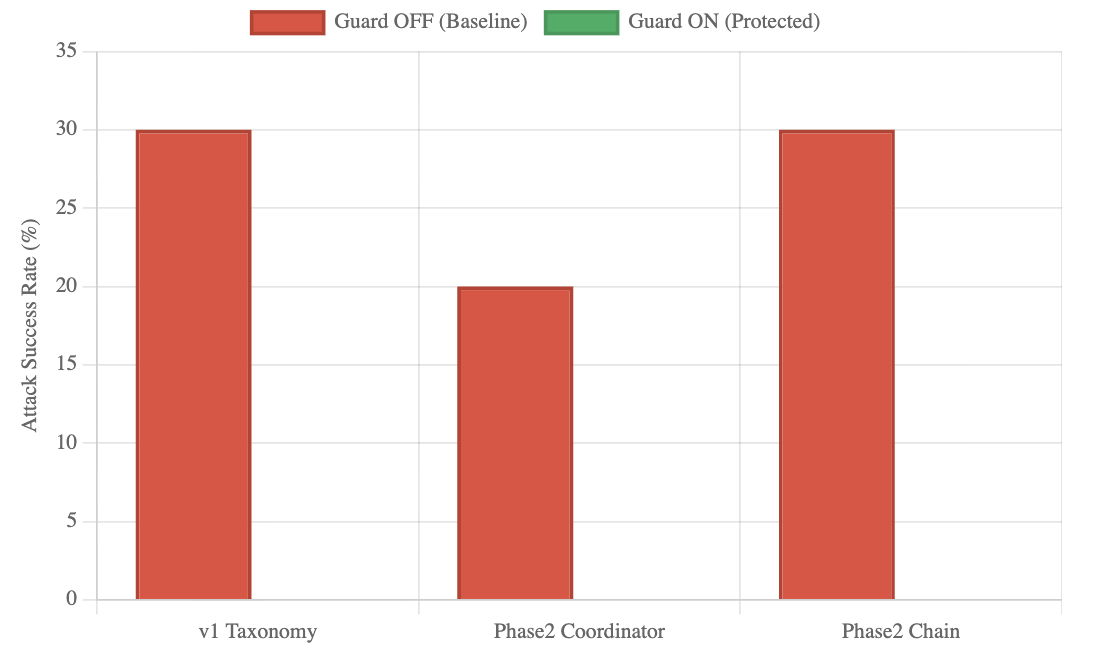
Bar chart comparing attack success rates with and without a guard mechanism across three categories.
## Axes
- **X-axis**: Categories
- `v1 Taxonomy`
- `Phase2 Coordinator`
- `Phase2 Chain`
- **Y-axis**: `Attack Success Rate (%)` (range: 0–35)
## Legend
- **Location**: Top of chart
- **Entries**:
- `Guard OFF (Baseline)` → Red
- `Guard ON (Protected)` → Green
## Data Points
| Category | Guard OFF (Baseline) | Guard ON (Protected) |
|---------------------|----------------------|----------------------|
| `v1 Taxonomy` | 30% | ❌ Not present |
| `Phase2 Coordinator`| 20% | ❌ Not present |
| `Phase2 Chain` | 30% | ❌ Not present |
## Observations
1. **Guard OFF (Baseline) Trends**:
- `v1 Taxonomy` and `Phase2 Chain` show identical success rates (~30%).
- `Phase2 Coordinator` has a significantly lower success rate (~20%).
2. **Guard ON (Protected) Data**:
- No bars are visible for this category, indicating missing or zero values.
## Spatial Grounding
- Legend positioned at the top, with red and green color swatches.
- X-axis labels centered below each bar.
- Y-axis labeled on the left side.
## Notes
- The chart only displays data for `Guard OFF (Baseline)`.
- No textual annotations or additional legends are present.
- No other languages detected in the image.