## Line Charts: Cross Entropy vs. % of Interleaved Data
### Overview
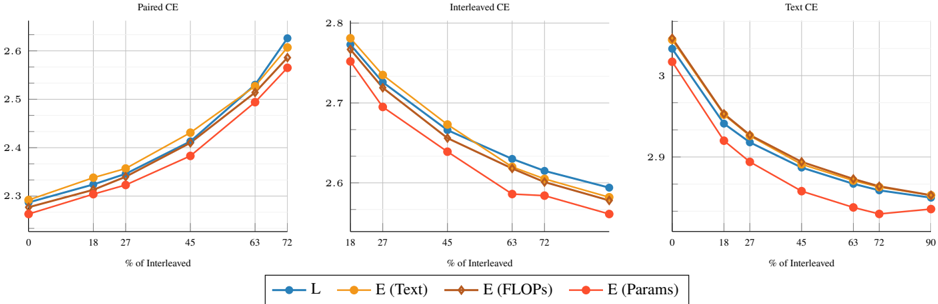
The image presents three line charts comparing the cross-entropy (CE) for different data interleaving strategies. The charts are titled "Paired CE", "Interleaved CE", and "Text CE". Each chart plots the cross-entropy value against the percentage of interleaved data, ranging from 0% to 72% for the first two charts and 0% to 90% for the third. Four different data series are compared: 'L', 'E (Text)', 'E (FLOPs)', and 'E (Params)'.
### Components/Axes
* **Titles:**
* Left Chart: "Paired CE"
* Middle Chart: "Interleaved CE"
* Right Chart: "Text CE"
* **X-axis:** "% of Interleaved"
* Left Chart: Values at 0, 18, 27, 45, 63, 72
* Middle Chart: Values at 18, 27, 45, 63, 72
* Right Chart: Values at 0, 18, 27, 45, 63, 72, 90
* **Y-axis:** Cross Entropy (CE)
* Left Chart: Scale from 2.3 to 2.6
* Middle Chart: Scale from 2.6 to 2.8
* Right Chart: Scale from 2.8 to 3.0
* **Legend:** Located at the bottom of the image.
* Blue line: "L"
* Yellow line: "E (Text)"
* Brown line: "E (FLOPs)"
* Red line: "E (Params)"
### Detailed Analysis
#### Paired CE (Left Chart)
* **L (Blue):** The line slopes upward.
* 0%: ~2.28
* 18%: ~2.32
* 27%: ~2.34
* 45%: ~2.40
* 63%: ~2.50
* 72%: ~2.60
* **E (Text) (Yellow):** The line slopes upward.
* 0%: ~2.29
* 18%: ~2.35
* 27%: ~2.36
* 45%: ~2.44
* 63%: ~2.54
* 72%: ~2.65
* **E (FLOPs) (Brown):** The line slopes upward.
* 0%: ~2.27
* 18%: ~2.31
* 27%: ~2.35
* 45%: ~2.42
* 63%: ~2.52
* 72%: ~2.58
* **E (Params) (Red):** The line slopes upward.
* 0%: ~2.26
* 18%: ~2.30
* 27%: ~2.31
* 45%: ~2.38
* 63%: ~2.50
* 72%: ~2.52
#### Interleaved CE (Middle Chart)
* **L (Blue):** The line slopes downward.
* 18%: ~2.78
* 27%: ~2.74
* 45%: ~2.68
* 63%: ~2.62
* 72%: ~2.60
* **E (Text) (Yellow):** The line slopes downward.
* 18%: ~2.79
* 27%: ~2.75
* 45%: ~2.68
* 63%: ~2.62
* 72%: ~2.60
* **E (FLOPs) (Brown):** The line slopes downward.
* 18%: ~2.76
* 27%: ~2.72
* 45%: ~2.66
* 63%: ~2.59
* 72%: ~2.58
* **E (Params) (Red):** The line slopes downward.
* 18%: ~2.70
* 27%: ~2.68
* 45%: ~2.62
* 63%: ~2.58
* 72%: ~2.54
#### Text CE (Right Chart)
* **L (Blue):** The line slopes downward.
* 0%: ~3.02
* 18%: ~2.95
* 27%: ~2.92
* 45%: ~2.88
* 63%: ~2.86
* 72%: ~2.84
* 90%: ~2.83
* **E (Text) (Yellow):** The line slopes downward.
* 0%: ~3.03
* 18%: ~2.96
* 27%: ~2.93
* 45%: ~2.89
* 63%: ~2.86
* 72%: ~2.84
* 90%: ~2.83
* **E (FLOPs) (Brown):** The line slopes downward.
* 0%: ~3.01
* 18%: ~2.94
* 27%: ~2.91
* 45%: ~2.87
* 63%: ~2.85
* 72%: ~2.83
* 90%: ~2.82
* **E (Params) (Red):** The line slopes downward.
* 0%: ~2.98
* 18%: ~2.88
* 27%: ~2.83
* 45%: ~2.78
* 63%: ~2.75
* 72%: ~2.74
* 90%: ~2.73
### Key Observations
* In the "Paired CE" chart, all lines show an increasing trend in cross-entropy as the percentage of interleaved data increases.
* In the "Interleaved CE" and "Text CE" charts, all lines show a decreasing trend in cross-entropy as the percentage of interleaved data increases.
* The "E (Params)" series (red line) consistently has the lowest cross-entropy values in all three charts, especially as the percentage of interleaved data increases in the "Interleaved CE" and "Text CE" charts.
* The "E (Text)" series (yellow line) and "L" series (blue line) are very close to each other in all three charts.
* The "E (FLOPs)" series (brown line) is generally between the "E (Text)" and "E (Params)" series.
### Interpretation
The charts suggest that interleaving data has different effects on cross-entropy depending on the type of data being considered (Paired, Interleaved, or Text). For "Paired CE", interleaving seems to worsen the cross-entropy, while for "Interleaved CE" and "Text CE", it improves the cross-entropy. The "E (Params)" series consistently performs the best (lowest cross-entropy) as the percentage of interleaved data increases for "Interleaved CE" and "Text CE", indicating that this configuration might be more robust or efficient when dealing with interleaved data. The close proximity of the "E (Text)" and "L" series suggests that these two configurations behave similarly with respect to data interleaving.