## Line Charts: Contrastive Loss vs. Interleaving Percentage
### Overview
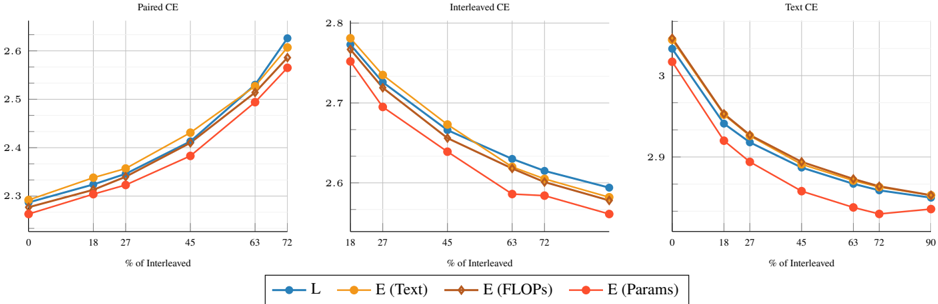
The image presents three line charts, each depicting the relationship between a contrastive loss metric (y-axis) and the percentage of interleaving (x-axis). The charts compare different evaluation methods: Paired CE, Interleaved CE, and Text CE. Each chart contains four data series, representing different evaluation components: 'L', 'E (Text)', 'E (FLOPs)', and 'E (Params)'.
### Components/Axes
* **X-axis:** "% of Interleaved" - Represents the percentage of interleaving, with scales varying for each chart:
* Paired CE: 0, 27, 45, 63, 72
* Interleaved CE: 18, 27, 45, 63, 72
* Text CE: 0, 18, 45, 63, 72, 90
* **Y-axis:** Contrastive Loss - The vertical axis represents the contrastive loss value. The scales vary for each chart:
* Paired CE: Approximately 2.3 to 2.7
* Interleaved CE: Approximately 2.55 to 2.8
* Text CE: Approximately 2.85 to 3.1
* **Legend:** Located at the bottom-center of the image.
* Blue Line ('L'): Represents a loss metric labeled 'L'.
* Green Line ('E (Text)'): Represents a loss metric labeled 'E (Text)'.
* Orange Line ('E (FLOPs)'): Represents a loss metric labeled 'E (FLOPs)'.
* Red Line ('E (Params)'): Represents a loss metric labeled 'E (Params)'.
* **Chart Titles:**
* Top-Left: "Paired CE"
* Top-Center: "Interleaved CE"
* Top-Right: "Text CE"
### Detailed Analysis or Content Details
**Paired CE Chart:**
* 'L' (Blue): Starts at approximately 2.3, increases to approximately 2.65 at 63% interleaving, and decreases slightly to approximately 2.6 at 72% interleaving.
* 'E (Text)' (Green): Starts at approximately 2.35, increases to approximately 2.7 at 63% interleaving, and decreases slightly to approximately 2.65 at 72% interleaving.
* 'E (FLOPs)' (Orange): Starts at approximately 2.3, increases to approximately 2.6 at 63% interleaving, and decreases slightly to approximately 2.55 at 72% interleaving.
* 'E (Params)' (Red): Starts at approximately 2.35, increases to approximately 2.7 at 63% interleaving, and decreases slightly to approximately 2.65 at 72% interleaving.
**Interleaved CE Chart:**
* 'L' (Blue): Starts at approximately 2.75, decreases to approximately 2.6 at 72% interleaving.
* 'E (Text)' (Green): Starts at approximately 2.78, decreases to approximately 2.62 at 72% interleaving.
* 'E (FLOPs)' (Orange): Starts at approximately 2.75, decreases to approximately 2.6 at 72% interleaving.
* 'E (Params)' (Red): Starts at approximately 2.77, decreases to approximately 2.6 at 72% interleaving.
**Text CE Chart:**
* 'L' (Blue): Starts at approximately 3.0, decreases to approximately 2.85 at 90% interleaving.
* 'E (Text)' (Green): Starts at approximately 3.05, decreases to approximately 2.88 at 90% interleaving.
* 'E (FLOPs)' (Orange): Starts at approximately 3.0, decreases to approximately 2.85 at 90% interleaving.
* 'E (Params)' (Red): Starts at approximately 3.05, decreases to approximately 2.9 at 90% interleaving.
### Key Observations
* In the "Paired CE" chart, all lines exhibit a similar upward trend up to 63% interleaving, followed by a slight decrease.
* In the "Interleaved CE" and "Text CE" charts, all lines consistently decrease as the percentage of interleaving increases, indicating a reduction in contrastive loss.
* The "Text CE" chart generally shows higher loss values compared to the other two charts.
* The lines representing 'L', 'E (Text)', 'E (FLOPs)', and 'E (Params)' are relatively close to each other within each chart, suggesting a consistent relationship between these evaluation components.
### Interpretation
The charts demonstrate the impact of interleaving on contrastive loss across different evaluation methods. The "Paired CE" chart suggests that increasing interleaving initially increases loss, potentially due to increased difficulty in distinguishing between samples, but beyond a certain point (around 63%), further interleaving may slightly reduce loss. The "Interleaved CE" and "Text CE" charts indicate that interleaving generally reduces contrastive loss, implying that interleaving improves the model's ability to differentiate between samples. The higher loss values in the "Text CE" chart might suggest that text-based evaluation is more sensitive to the effects of interleaving or that the text data itself is more challenging to evaluate. The close proximity of the lines within each chart suggests that the different evaluation components ('L', 'E (Text)', 'E (FLOPs)', 'E (Params)') are correlated and respond similarly to changes in interleaving. The charts provide insights into the optimal level of interleaving for different evaluation scenarios, potentially guiding the design of more effective contrastive learning strategies.