# Technical Diagram Analysis
## Diagram Overview
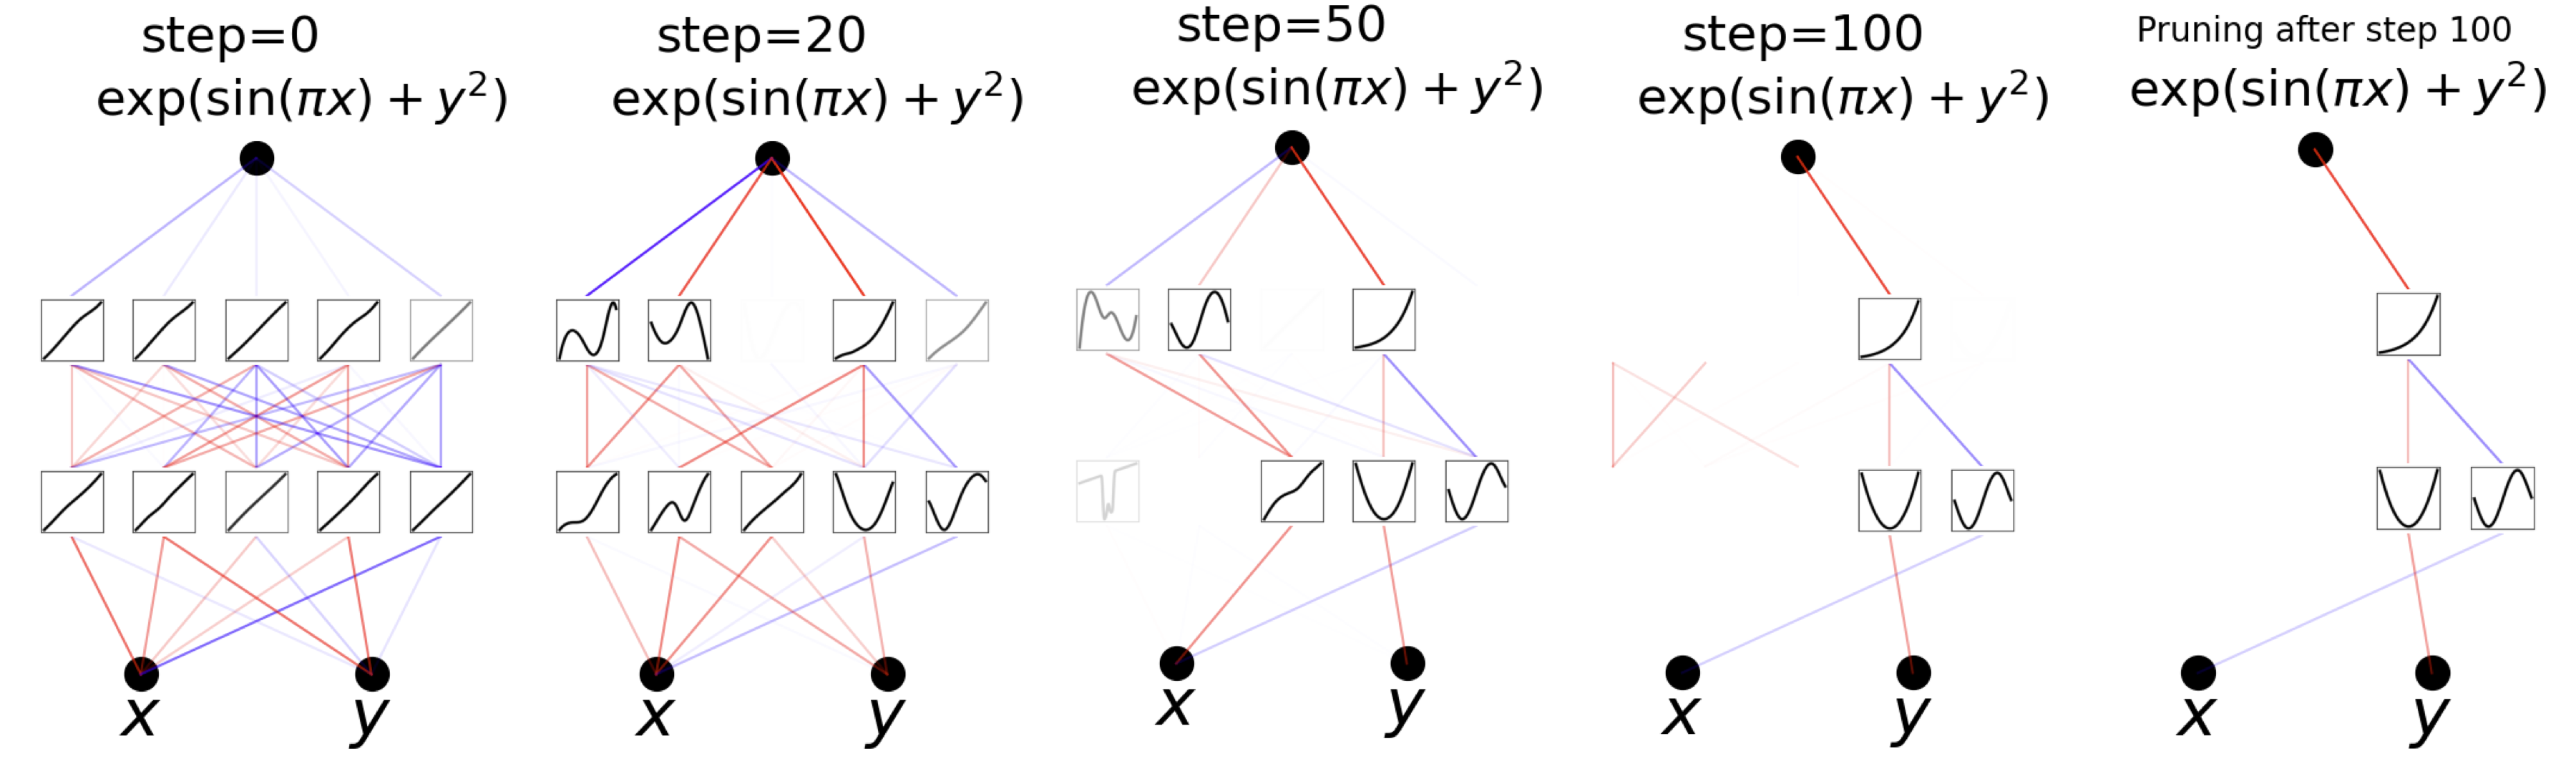
The image depicts a sequence of interconnected diagrams illustrating a computational process involving variables **x** and **y** across multiple steps. Each diagram represents a stage in the process, with mathematical expressions and graphical components.
---
## Step-by-Step Breakdown
### Step 0
- **Label**: `step=0`
- **Mathematical Expression**: `exp(sin(πx) + y²)`
- **Components**:
- **Nodes**: Two black circles labeled **x** and **y**.
- **Connections**: Multiple red, blue, and gray lines connecting **x** and **y** to intermediate nodes.
- **Intermediate Nodes**: 5 small squares containing diagonal lines (likely representing linear functions or placeholders).
### Step 20
- **Label**: `step=20`
- **Mathematical Expression**: `exp(sin(πx) + y²)`
- **Components**:
- **Nodes**: Same **x** and **y** nodes as Step 0.
- **Connections**: Simplified network with fewer lines (red and blue dominate).
- **Intermediate Nodes**: 5 small squares with wavy lines (non-linear functions or dynamic data).
### Step 50
- **Label**: `step=50`
- **Mathematical Expression**: `exp(sin(πx) + y²)`
- **Components**:
- **Nodes**: **x** and **y** nodes persist.
- **Connections**: Further reduced complexity; red lines dominate.
- **Intermediate Nodes**: 4 small squares with varying waveforms (e.g., sinusoidal, parabolic).
### Step 100
- **Label**: `step=100`
- **Mathematical Expression**: `exp(sin(πx) + y²)`
- **Components**:
- **Nodes**: **x** and **y** nodes remain.
- **Connections**: Minimal lines (red and blue only).
- **Intermediate Nodes**: 3 small squares with simplified waveforms.
### Pruning After Step 100
- **Label**: `Pruning after step 100`
- **Mathematical Expression**: `exp(sin(πx) + y²)`
- **Components**:
- **Nodes**: **x** and **y** nodes.
- **Connections**: Single red line directly connecting **x** to **y**.
- **Intermediate Nodes**: 2 small squares with basic waveforms (likely final output or critical data points).
---
## Key Observations
1. **Mathematical Consistency**: The expression `exp(sin(πx) + y²)` is constant across all steps, suggesting it is the core function being iteratively processed.
2. **Node Evolution**: The **x** and **y** nodes remain central throughout, acting as input/output anchors.
3. **Line Color Significance**:
- **Red Lines**: Likely represent primary data flow or critical connections.
- **Blue Lines**: May indicate secondary or auxiliary pathways.
- **Gray Lines**: Possibly transitional or deprecated connections.
4. **Pruning Effect**: After Step 100, the diagram simplifies to a direct **x**→**y** connection, implying optimization or elimination of redundant pathways.
---
## Diagram Flow
1. **Initialization (Step 0)**: Complex network with multiple intermediate nodes.
2. **Iteration (Steps 20–100)**: Gradual reduction in complexity, with intermediate nodes evolving from linear to non-linear representations.
3. **Finalization (Pruning)**: Streamlined to a minimal structure, retaining only essential connections.
---
## Notes
- No explicit legends or axis titles are present in the image.
- The small squares with graphs likely represent intermediate computational results or function evaluations.
- The process appears to model a dynamic system where complexity decreases over time, culminating in a simplified, optimized state.