\n
## Diagram: Multisplit Radix Sort Visualization
### Overview
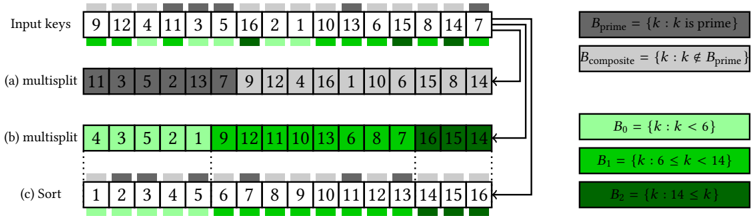
The image depicts a visualization of the multisplit radix sort algorithm. It shows the progression of a set of input keys through multiple splits and sorting stages. The diagram illustrates how the keys are distributed based on prime/composite status and then sorted within each resulting bucket.
### Components/Axes
The diagram consists of four horizontal rows representing different stages of the algorithm:
1. **Input keys:** The initial unsorted sequence of numbers.
2. **(a) multisplit:** The first split based on whether a key is prime or composite.
3. **(b) multisplit:** The second split, further dividing keys based on ranges.
4. **(c) Sort:** The final sorted sequence.
A legend on the right side defines the color coding:
* `B_prime = (k : k is prime)` - Light Green
* `B_composite = (k : k ∉ B_prime)` - Gray
* `B_0 = (k : k < 6)` - Yellow
* `B_1 = (k : 6 ≤ k < 14)` - Green
* `B_2 = (k : 14 ≤ k)` - Dark Green
Vertical dotted lines visually separate the keys within each stage.
### Detailed Analysis / Content Details
**Input keys:** The initial sequence is: 9, 12, 4, 11, 3, 5, 16, 2, 1, 10, 13, 6, 15, 8, 14, 7.
**(a) multisplit:** This stage splits the keys into prime and composite numbers.
* Prime numbers (light green): 2, 3, 5, 7, 11, 13
* Composite numbers (gray): 4, 6, 8, 9, 10, 12, 14, 15, 16
The resulting sequence is: 11, 3, 5, 2, 13, 9, 12, 4, 16, 1, 10, 6, 15, 8, 14, 7.
**(b) multisplit:** This stage further splits the composite numbers into ranges.
* `B_0 = (k : k < 6)` (yellow): 4
* `B_1 = (k : 6 ≤ k < 14)` (green): 6, 8, 9, 10, 12
* `B_2 = (k : 14 ≤ k)` (dark green): 14, 15, 16
The resulting sequence is: 4, 3, 5, 2, 11, 13, 9, 12, 16, 1, 10, 6, 15, 8, 14, 7.
**(c) Sort:** This stage shows the final sorted sequence.
* 1, 2, 3, 4, 5, 6, 7, 8, 9, 10, 11, 12, 13, 14, 15, 16
### Key Observations
The diagram clearly demonstrates the process of radix sort. The initial split separates primes from composites. The subsequent split divides the composite numbers into buckets based on their value ranges. Finally, the keys are sorted within each bucket, resulting in a fully sorted sequence. The color coding effectively highlights the different categories and their progression through the algorithm.
### Interpretation
This diagram illustrates the core principle of radix sort: breaking down a sorting problem into smaller, more manageable subproblems based on the digits (or in this case, prime/composite status and value ranges) of the keys. The multisplit approach enhances the efficiency of the algorithm by distributing the keys more evenly across the buckets. The final sorted sequence confirms the correctness of the algorithm. The use of color coding makes the process visually intuitive and easy to understand. The diagram effectively communicates the steps involved in a multisplit radix sort, showcasing its ability to sort a set of numbers efficiently. The diagram does not provide any performance metrics or comparisons to other sorting algorithms; it is purely a visual representation of the process.