## Diagram: Data Processing and Sorting Algorithm
### Overview
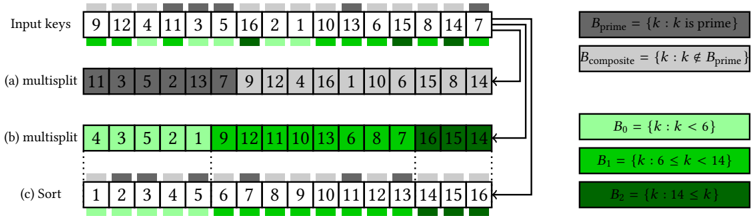
The diagram illustrates a multi-step data processing workflow involving input keys, multisplit operations, and sorting. It uses color-coded categories to represent numerical properties (prime/composite, value ranges) and demonstrates how these properties influence data organization.
### Components/Axes
1. **Input Keys** (Top Row):
- Values: `9, 12, 4, 11, 3, 5, 10, 6, 2, 1, 13, 15, 8, 14, 7`
- Colors: Gray (primes), Green (composites), Dark Green (B2: k ≥14)
2. **Legend** (Right Side):
- **B_prime**: Gray (`k` is prime)
- **B_composite**: Green (`k` is composite)
- **B0**: Light Green (`k < 6`)
- **B1**: Medium Green (`6 ≤ k < 14`)
- **B2**: Dark Green (`k ≥ 14`)
3. **Sections**:
- **(a) Multisplit**: First partitioning step (primes vs. composites).
- **(b) Multisplit**: Second partitioning step (B0, B1, B2 ranges).
- **(c) Sort**: Final sorted output (1–16 in ascending order).
### Detailed Analysis
1. **Input Keys**:
- Primes (gray): `11, 3, 5, 2, 13, 7`
- Composites (green): `9, 12, 4, 10, 6, 15, 8, 14`
- Note: `1` is composite (green) despite being neither prime nor composite.
2. **Section (a) Multisplit**:
- Primes (gray): `11, 3, 5, 2, 13, 7`
- Composites (green): `9, 12, 4, 16, 1, 10, 6, 15, 8, 14`
- **Anomaly**: `14` (B2: k ≥14) is green instead of dark green.
3. **Section (b) Multisplit**:
- B0 (light green): `4, 3, 5, 2, 1`
- B1 (medium green): `9, 12, 11, 10, 13, 6, 8, 7`
- B2 (dark green): `16, 15, 14`
- **Consistency**: Colors align with B0/B1/B2 ranges.
4. **Section (c) Sort**:
- Output: `1, 2, 3, 4, 5, 6, 7, 8, 9, 10, 11, 12, 13, 14, 15, 16`
- Colors: All dark green (B2), conflicting with B0/B1/B2 ranges.
### Key Observations
- **Color Mismatch**: In section (a), `14` (B2) is green instead of dark green. In section (c), all values are dark green despite spanning B0/B1/B2 ranges.
- **Sorting Logic**: The final sorted list ignores prior color categorizations, suggesting a reset or reclassification step.
- **Prime/Composite Split**: Section (a) separates primes (gray) from composites (green), while section (b) further subdivides composites into B0/B1/B2.
### Interpretation
The diagram demonstrates a hierarchical data processing pipeline:
1. **Prime/Composite Separation**: Initial split isolates primes (gray) and composites (green).
2. **Range-Based Partitioning**: Composites are further divided into B0 (small values), B1 (mid-range), and B2 (large values).
3. **Sorting**: Final step orders all values numerically, overriding prior categorizations.
**Notable Anomalies**:
- `14` is misclassified in section (a) (green instead of dark green).
- Section (c) uses uniform dark green, conflicting with B0/B1/B2 definitions. This may indicate a visualization error or a conceptual shift in categorization during sorting.
**Significance**:
The workflow highlights how data properties (primality, magnitude) can guide partitioning strategies, though inconsistencies in color coding suggest potential ambiguities in the algorithm’s implementation or visualization.