## Diagram: Base Station Communication with Coalitions and Time Slots
### Overview
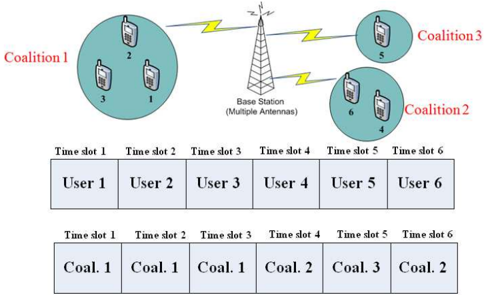
The diagram illustrates a communication system where a **Base Station (Multiple Antennas)** interacts with three coalitions of users. Each coalition contains multiple users, and communication occurs in **six time slots**. The system uses **time-division multiplexing** to allocate resources, with users and coalitions assigned to specific time slots.
### Components/Axes
- **Top Diagram**:
- **Base Station**: Central tower with multiple antennas, emitting signals (yellow lightning bolts) to three coalitions.
- **Coalitions**:
- **Coalition 1** (red): Contains users 1, 2, 3.
- **Coalition 2** (blue): Contains users 4, 6.
- **Coalition 3** (green): Contains user 5.
- **Legend**:
- Red = Coalition 1
- Blue = Coalition 2
- Green = Coalition 3
- **Bottom Table**:
- **X-Axis**: Time slots (1–6).
- **Y-Axis**: Two rows:
- **Row 1**: Users (User 1–6).
- **Row 2**: Coalitions (Coal. 1–3).
- **Structure**:
- Each time slot is split into two cells: one for a user and one for a coalition.
### Detailed Analysis
#### Time Slot Assignments
| Time Slot | User | Coalition |
|-----------|--------|-----------|
| 1 | User 1 | Coal. 1 |
| 2 | User 2 | Coal. 1 |
| 3 | User 3 | Coal. 1 |
| 4 | User 4 | Coal. 2 |
| 5 | User 5 | Coal. 3 |
| 6 | User 6 | Coal. 2 |
#### Spatial Grounding
- **Legend**: Located on the right side of the diagram, with red (Coal. 1), blue (Coal. 2), and green (Coal. 3) labels.
- **Base Station**: Centered at the top, with antennas radiating signals to coalitions.
- **Coalitions**: Positioned in circles on the left (Coal. 1), right (Coal. 2), and top-right (Coal. 3).
- **Time Slots**: Labeled sequentially from left to right (1–6) in the table.
### Key Observations
1. **Coalition 1** dominates early time slots (1–3), with all three users assigned.
2. **Coalition 2** shares time slots 4 and 6, with users 4 and 6.
3. **Coalition 3** has a single user (User 5) in time slot 5.
4. The base station’s multiple antennas suggest **spatial multiplexing** to handle concurrent communications.
### Interpretation
This diagram demonstrates a **resource allocation strategy** for a multi-user wireless system. By dividing time into slots, the base station ensures fair access for users across coalitions. The use of multiple antennas implies **beamforming** or **MIMO (Multiple Input Multiple Output)** techniques to enhance signal quality and reduce interference.
- **Notable Patterns**:
- Coalition 1 has the most users and time slots, suggesting higher priority or demand.
- Coalition 3 has only one user, indicating lower activity or a smaller group.
- **Flow**: Signals from the base station are directed to coalitions, with users in each coalition scheduled in specific time slots to avoid collisions.
- **Implications**: The system balances load across coalitions and optimizes bandwidth usage through time and spatial resource partitioning.
### Uncertainties
- Exact technical specifications of the base station (e.g., antenna count, frequency bands) are not provided.
- The diagram does not clarify whether time slots are fixed or dynamically adjusted.
- No data on signal strength, latency, or error rates is included.