\n
## Diagram: Wireless Coalition Communication Network
### Overview
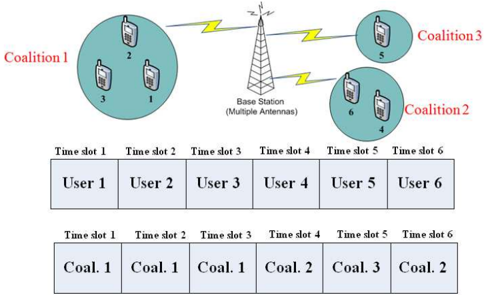
The image depicts a wireless communication network scenario involving three coalitions (Coalition 1, Coalition 2, and Coalition 3) communicating through a base station. The diagram illustrates the allocation of time slots to individual users and the corresponding coalition affiliation for each time slot.
### Components/Axes
* **Base Station:** Located centrally, labeled "Base Station (Multiple Antennas)".
* **Coalitions:** Three coalitions are represented by circles labeled "Coalition 1" (top-left), "Coalition 2" (bottom-right), and "Coalition 3" (top-right). Each coalition contains multiple user devices (represented by mobile phone icons).
* **Users:** Six users are represented, numbered 1 through 6.
* **Time Slots:** Six time slots are represented, labeled "Time slot 1" through "Time slot 6".
* **User Allocation Table:** A table showing which user is allocated to each time slot. The table headers are "Time slot 1" to "Time slot 6", and the rows are labeled "User 1" to "User 6".
* **Coalition Allocation Table:** A table showing which coalition is active during each time slot. The table headers are "Time slot 1" to "Time slot 6", and the rows are labeled "Coal. 1", "Coal. 1", "Coal. 1", "Coal. 2", "Coal. 3", "Coal. 2".
### Detailed Analysis or Content Details
* **Coalition 1:** Contains users 1, 2, and 3.
* **Coalition 2:** Contains users 4 and 6.
* **Coalition 3:** Contains user 5.
* **User Allocation:**
* Time slot 1: User 1
* Time slot 2: User 2
* Time slot 3: User 3
* Time slot 4: User 4
* Time slot 5: User 5
* Time slot 6: User 6
* **Coalition Allocation:**
* Time slot 1: Coalition 1
* Time slot 2: Coalition 1
* Time slot 3: Coalition 1
* Time slot 4: Coalition 2
* Time slot 5: Coalition 3
* Time slot 6: Coalition 2
### Key Observations
* Coalition 1 has exclusive access to the first three time slots.
* Coalition 2 has access to time slots 4 and 6.
* Coalition 3 has access to time slot 5.
* Each time slot is allocated to a single user.
* The diagram suggests a time-division multiple access (TDMA) scheme where each coalition or user is assigned a specific time slot for communication.
### Interpretation
The diagram illustrates a resource allocation strategy in a wireless communication network where multiple coalitions compete for access to a shared base station. The time slots are allocated to different coalitions to avoid interference and ensure fair access. The allocation scheme appears to be static, with each coalition having pre-defined time slots. This could be a simplified representation of a more complex dynamic allocation algorithm. The diagram suggests a scenario where coalitions may have different priorities or requirements, leading to the unequal allocation of time slots. The use of multiple antennas at the base station implies the potential for spatial division multiple access (SDMA) or beamforming techniques to further enhance network capacity and performance, but this is not explicitly shown in the diagram. The diagram is a conceptual illustration and does not provide any quantitative data on channel conditions, signal strength, or interference levels.