## Scatter Plot: Prehistory Confidence vs. Target Length
### Overview
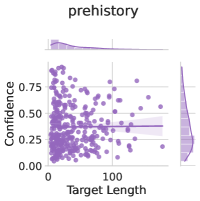
The image is a scatter plot titled "prehistory" showing the relationship between "Confidence" (y-axis) and "Target Length" (x-axis). The data points are represented by purple circles. There are marginal density plots along the x and y axes. A regression line with a shaded confidence interval is also plotted.
### Components/Axes
* **Title:** prehistory
* **X-axis:** Target Length
* Scale: 0 to 100
* **Y-axis:** Confidence
* Scale: 0.00 to 0.75
* **Data Points:** Purple circles representing individual data points.
* **Regression Line:** A purple line showing the linear relationship between Target Length and Confidence.
* **Confidence Interval:** A shaded purple region around the regression line, indicating the uncertainty in the estimated relationship.
* **Marginal Density Plots:** Histograms and density curves along the x and y axes showing the distribution of Target Length and Confidence, respectively.
### Detailed Analysis
* **Data Point Distribution:** The data points are concentrated at lower Target Length values (0-20), with Confidence values ranging from approximately 0.00 to 0.75. As Target Length increases, the density of data points decreases, and the Confidence values appear to be more scattered.
* **Regression Line:** The regression line is nearly horizontal, suggesting a weak or non-existent linear relationship between Target Length and Confidence.
* **Confidence Interval:** The confidence interval is relatively wide, indicating a high degree of uncertainty in the estimated relationship.
* **Marginal Density Plots:**
* **Target Length:** The density plot shows a strong peak near 0, indicating that most data points have low Target Length values.
* **Confidence:** The density plot shows a peak around 0.25, indicating that most data points have Confidence values around 0.25.
### Key Observations
* The majority of data points have low Target Length values.
* There is a weak or non-existent linear relationship between Target Length and Confidence.
* There is a high degree of uncertainty in the estimated relationship.
### Interpretation
The scatter plot suggests that, for the "prehistory" dataset, there is no strong correlation between the target length and the confidence. The concentration of data points at low target length values indicates that the model may be more confident when dealing with shorter targets. The wide confidence interval around the regression line suggests that the relationship between target length and confidence is not well-defined or consistent.