## Scatter Plot with Marginal Distributions: Prehistory Confidence vs. Target Length
### Overview
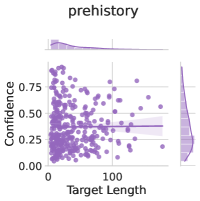
The image is a statistical visualization, specifically a scatter plot with marginal distribution plots (histograms/density plots) on the top and right sides. The chart is titled "prehistory" and explores the relationship between "Target Length" and "Confidence." The primary data is represented by purple points, with corresponding marginal distributions shown in the same color.
### Components/Axes
* **Main Plot (Center):**
* **X-Axis:** Labeled "Target Length." The scale runs from 0 to approximately 200, with major tick marks at 0 and 100.
* **Y-Axis:** Labeled "Confidence." The scale runs from 0.00 to 1.00, with major tick marks at 0.00, 0.25, 0.50, 0.75, and 1.00.
* **Data Series:** A single series of purple circular points scattered across the plot area.
* **Marginal Plot (Top):**
* Positioned above the main plot, aligned with the X-axis.
* Displays the distribution of the "Target Length" variable. It appears as a right-skewed density plot or histogram.
* **Marginal Plot (Right):**
* Positioned to the right of the main plot, aligned with the Y-axis.
* Displays the distribution of the "Confidence" variable. It appears as a bimodal density plot or histogram.
* **Color/Legend:** All data elements (scatter points, marginal plots) use a consistent shade of purple. There is no separate legend box; the color coding is implicit and consistent across all components.
### Detailed Analysis
* **Scatter Point Distribution:**
* The points are most densely clustered in the lower-left quadrant of the plot, corresponding to **Target Lengths between approximately 0-100** and **Confidence values between 0.00-0.50**.
* There is a wide vertical spread of Confidence values for shorter Target Lengths (0-50), ranging from near 0.00 to above 0.75.
* As Target Length increases beyond ~100, the density of points decreases, and the Confidence values appear to trend lower, mostly below 0.50.
* A few outlier points exist with high Confidence (>0.75) at moderate Target Lengths (~50-100).
* **Marginal Distribution - Target Length (Top):**
* The distribution is **right-skewed**. The peak density (mode) appears to be at a relatively low Target Length, approximately in the **30-70 range**.
* The tail extends to the right, indicating fewer instances of very long targets (approaching 200).
* **Marginal Distribution - Confidence (Right):**
* The distribution is **bimodal**. There are two distinct peaks.
* The primary, larger peak is at a **low Confidence level, approximately 0.20-0.30**.
* A secondary, smaller peak is at a **moderate-to-high Confidence level, approximately 0.65-0.75**.
* A faint horizontal line is visible within this marginal plot at approximately **Confidence = 0.50**, which may represent a median or a reference threshold.
### Key Observations
1. **Inverse Relationship Trend:** There is a general, weak inverse trend visible. Points with higher Target Lengths (>100) tend to have lower Confidence scores, clustering below 0.50.
2. **High Variance at Low Length:** For short Target Lengths (<50), Confidence is highly variable, spanning almost the entire possible range (0.00 to >0.75).
3. **Bimodal Confidence:** The Confidence metric is not normally distributed. The data suggests two predominant groups: one with low confidence (~0.25) and another with moderately high confidence (~0.70).
4. **Data Sparsity:** The plot becomes sparse for Target Lengths greater than ~150, suggesting fewer data points in this range.
### Interpretation
This chart likely analyzes the performance or reliability of a system (e.g., a machine learning model, an archaeological dating method) applied to "prehistory" data. "Target Length" could refer to the temporal span, sequence length, or complexity of the historical subject being analyzed. "Confidence" represents the system's certainty in its output.
The data suggests that **the system is most frequently applied to, or performs with, moderate-to-low confidence on shorter, perhaps more granular historical targets.** The bimodal Confidence distribution is critical—it indicates the system's outputs are not uniformly uncertain but tend to cluster around two distinct certainty levels. This could imply the existence of two different classes of problems or data quality within the "prehistory" domain. The trend of decreasing confidence for longer targets might indicate that the system struggles with broader, more complex temporal scopes, or that longer targets are inherently more ambiguous. The high variance at short lengths suggests that for concise subjects, other factors beyond length heavily influence the system's confidence.