## Error Bar Chart: Solve Rate vs. Difficulty
### Overview
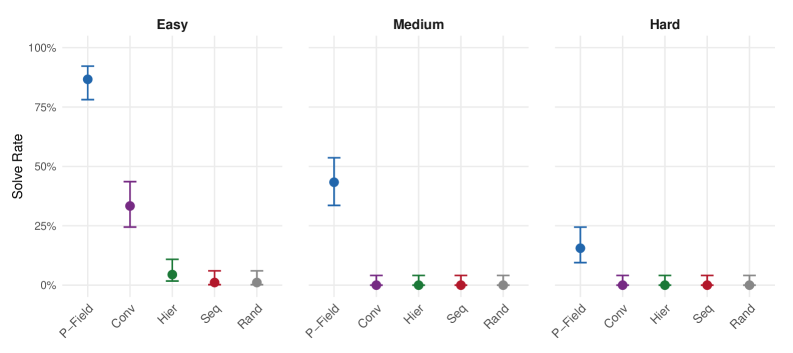
The image presents three error bar charts comparing the solve rates of different methods (P-Field, Conv, Hier, Seq, Rand) across three difficulty levels: Easy, Medium, and Hard. The y-axis represents the solve rate, ranging from 0% to 100%. Each chart corresponds to a different difficulty level, and each method is represented by a data point with error bars indicating the variability in the solve rate.
### Components/Axes
* **Title:** Solve Rate vs. Difficulty
* **X-axis:** Methods (P-Field, Conv, Hier, Seq, Rand)
* **Y-axis:** Solve Rate (0% to 100%, increments of 25%)
* **Difficulty Levels:** Easy, Medium, Hard (each represented by a separate chart)
* **Data Points:** Each method within each difficulty level is represented by a colored data point with error bars.
* P-Field: Blue
* Conv: Purple
* Hier: Green
* Seq: Red
* Rand: Gray
### Detailed Analysis
**Easy Difficulty:**
* **P-Field (Blue):** Solve rate is approximately 88%, with error bars ranging from about 78% to 98%.
* **Conv (Purple):** Solve rate is approximately 35%, with error bars ranging from about 25% to 45%.
* **Hier (Green):** Solve rate is approximately 5%, with error bars ranging from about 0% to 15%.
* **Seq (Red):** Solve rate is approximately 3%, with error bars ranging from about 0% to 10%.
* **Rand (Gray):** Solve rate is approximately 3%, with error bars ranging from about 0% to 10%.
**Medium Difficulty:**
* **P-Field (Blue):** Solve rate is approximately 45%, with error bars ranging from about 35% to 55%.
* **Conv (Purple):** Solve rate is approximately 1%, with error bars ranging from about 0% to 5%.
* **Hier (Green):** Solve rate is approximately 1%, with error bars ranging from about 0% to 5%.
* **Seq (Red):** Solve rate is approximately 1%, with error bars ranging from about 0% to 5%.
* **Rand (Gray):** Solve rate is approximately 1%, with error bars ranging from about 0% to 5%.
**Hard Difficulty:**
* **P-Field (Blue):** Solve rate is approximately 15%, with error bars ranging from about 5% to 25%.
* **Conv (Purple):** Solve rate is approximately 0%, with error bars ranging from about 0% to 5%.
* **Hier (Green):** Solve rate is approximately 0%, with error bars ranging from about 0% to 5%.
* **Seq (Red):** Solve rate is approximately 0%, with error bars ranging from about 0% to 5%.
* **Rand (Gray):** Solve rate is approximately 0%, with error bars ranging from about 0% to 5%.
### Key Observations
* **P-Field Dominance:** The P-Field method consistently has the highest solve rate across all difficulty levels.
* **Difficulty Impact:** The solve rate for all methods decreases as the difficulty level increases.
* **Convergence:** The solve rates for Conv, Hier, Seq, and Rand are very low and converge towards 0% as the difficulty increases.
* **Error Bar Size:** The error bars tend to be larger for P-Field, especially at easier difficulty levels, indicating greater variability in the solve rate.
### Interpretation
The data suggests that the P-Field method is significantly more effective at solving the problem than the other methods (Conv, Hier, Seq, and Rand). The solve rate is highly dependent on the difficulty level, with all methods experiencing a decrease in performance as the difficulty increases. The P-Field method maintains a noticeable advantage even at the "Hard" difficulty, suggesting it is more robust to increasing complexity. The small error bars for Conv, Hier, Seq, and Rand at higher difficulty levels indicate consistent failure, while the larger error bars for P-Field suggest that its performance, while still better, is more variable and potentially influenced by other factors.