\n
## Chart: Solve Rate by Difficulty and Puzzle Type
### Overview
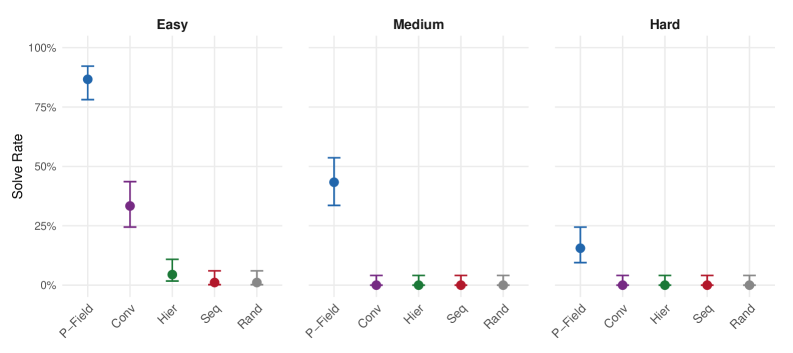
The image presents a chart displaying the solve rate for different puzzle types (P-Field, Conv, Hier, Seq, Rand) across three difficulty levels: Easy, Medium, and Hard. The data is represented using point plots with error bars, indicating the mean solve rate and its uncertainty.
### Components/Axes
* **X-axis:** Puzzle Type - Categories: P-Field, Conv, Hier, Seq, Rand.
* **Y-axis:** Solve Rate - Scale from 0% to 100%, with increments of 25%.
* **Chart Divisions:** Three vertical sections representing difficulty levels: Easy, Medium, and Hard. These are labeled at the top of each section.
* **Data Series:** Each puzzle type is represented by a different color:
* P-Field: Blue
* Conv: Purple
* Hier: Green
* Seq: Red
* Rand: Grey
* **Error Bars:** Vertical lines extending above and below each data point, representing the uncertainty or standard error of the solve rate.
### Detailed Analysis
The chart is divided into three sections, each representing a difficulty level. Within each section, there are five data points, one for each puzzle type.
**Easy Difficulty:**
* **P-Field:** Solve rate approximately 90% ± 5%. (Blue)
* **Conv:** Solve rate approximately 40% ± 10%. (Purple)
* **Hier:** Solve rate approximately 10% ± 5%. (Green)
* **Seq:** Solve rate approximately 5% ± 3%. (Red)
* **Rand:** Solve rate approximately 5% ± 3%. (Grey)
**Medium Difficulty:**
* **P-Field:** Solve rate approximately 55% ± 10%. (Blue)
* **Conv:** Solve rate approximately 10% ± 5%. (Purple)
* **Hier:** Solve rate approximately 5% ± 3%. (Green)
* **Seq:** Solve rate approximately 5% ± 3%. (Red)
* **Rand:** Solve rate approximately 5% ± 3%. (Grey)
**Hard Difficulty:**
* **P-Field:** Solve rate approximately 25% ± 8%. (Blue)
* **Conv:** Solve rate approximately 10% ± 5%. (Purple)
* **Hier:** Solve rate approximately 5% ± 3%. (Green)
* **Seq:** Solve rate approximately 5% ± 3%. (Red)
* **Rand:** Solve rate approximately 5% ± 3%. (Grey)
### Key Observations
* **Difficulty Impact:** Solve rates generally decrease as the difficulty level increases for all puzzle types.
* **P-Field Performance:** P-Field consistently exhibits the highest solve rates across all difficulty levels.
* **Low Performance:** Hier, Seq, and Rand consistently have very low solve rates across all difficulty levels, often near 0%.
* **Conv Performance:** Conv has a moderate solve rate on Easy, but drops significantly on Medium and Hard.
* **Error Bar Size:** Error bars are relatively small, suggesting a reasonable level of confidence in the reported solve rates.
### Interpretation
The data suggests that P-Field puzzles are significantly easier to solve than the other puzzle types (Conv, Hier, Seq, Rand), regardless of difficulty. The other puzzle types present a substantial challenge, with solve rates remaining consistently low even at the Easy difficulty level. The decrease in solve rates with increasing difficulty is expected, indicating that the difficulty levels are effectively differentiating the puzzles. The relatively small error bars suggest that the observed differences in solve rates are likely not due to random chance.
The consistent low performance of Hier, Seq, and Rand puzzles could indicate inherent complexities in their design or a lack of effective strategies for solving them. The drop in Conv solve rate from Easy to Medium/Hard suggests that the complexity of this puzzle type increases more rapidly with difficulty than P-Field. This data could be used to inform puzzle design, focusing on improving the solvability of the more challenging puzzle types or adjusting the difficulty scaling to provide a more balanced experience.