## Dot Plot with Error Bars: Solve Rate by Method and Difficulty
### Overview
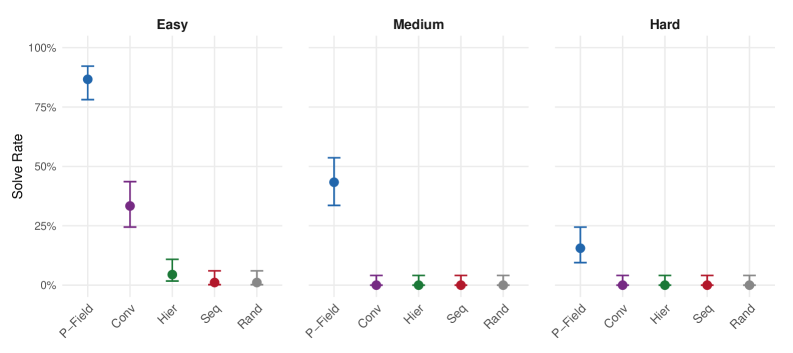
The image displays a three-panel dot plot comparing the "Solve Rate" of five different methods (P-Field, Conv, Hier, Seq, Rand) across three difficulty levels: Easy, Medium, and Hard. Each panel represents a difficulty level, and within each panel, the solve rate for each method is shown as a colored dot with vertical error bars indicating variability or confidence intervals.
### Components/Axes
* **Chart Type:** Three-panel dot plot with error bars.
* **Panel Titles (Top):** "Easy", "Medium", "Hard" (centered above each respective panel).
* **Y-Axis (Left):** Labeled "Solve Rate". The scale runs from 0% to 100%, with major tick marks at 0%, 25%, 50%, 75%, and 100%.
* **X-Axis (Bottom of each panel):** Lists the five methods. The labels are rotated approximately 45 degrees for readability. The order is consistent across panels: `P-Field`, `Conv`, `Hier`, `Seq`, `Rand`.
* **Data Series (Color-Coded):**
* **P-Field:** Blue dot and error bars.
* **Conv:** Purple dot and error bars.
* **Hier:** Green dot and error bars.
* **Seq:** Red dot and error bars.
* **Rand:** Gray dot and error bars.
* **Legend:** Not explicitly shown as a separate box. The method labels on the x-axis serve as the legend, with their associated colors consistently applied to the data points directly above them.
### Detailed Analysis
**Panel 1: Easy**
* **P-Field (Blue):** Highest solve rate. Dot is positioned at approximately 87%. Error bars extend from ~78% to ~95%.
* **Conv (Purple):** Second highest. Dot at ~33%. Error bars from ~25% to ~42%.
* **Hier (Green):** Very low. Dot at ~5%. Error bars from ~0% to ~12%.
* **Seq (Red):** Near zero. Dot at ~1%. Error bars from ~0% to ~5%.
* **Rand (Gray):** Near zero. Dot at ~0%. Error bars from ~0% to ~7%.
**Panel 2: Medium**
* **P-Field (Blue):** Still the highest, but reduced. Dot at ~43%. Error bars from ~33% to ~53%.
* **Conv (Purple):** Near zero. Dot at ~0%. Error bars from ~0% to ~3%.
* **Hier (Green):** Near zero. Dot at ~0%. Error bars from ~0% to ~2%.
* **Seq (Red):** Near zero. Dot at ~0%. Error bars from ~0% to ~2%.
* **Rand (Gray):** Near zero. Dot at ~0%. Error bars from ~0% to ~5%.
**Panel 3: Hard**
* **P-Field (Blue):** Lowest among the P-Field results, but still the highest in this panel. Dot at ~15%. Error bars from ~8% to ~23%.
* **Conv (Purple):** Near zero. Dot at ~0%. Error bars from ~0% to ~2%.
* **Hier (Green):** Near zero. Dot at ~0%. Error bars from ~0% to ~2%.
* **Seq (Red):** Near zero. Dot at ~0%. Error bars from ~0% to ~2%.
* **Rand (Gray):** Near zero. Dot at ~0%. Error bars from ~0% to ~5%.
### Key Observations
1. **Dominant Performance:** The `P-Field` method (blue) significantly outperforms all other methods across all difficulty levels.
2. **Clear Difficulty Trend:** The solve rate for `P-Field` decreases sharply as task difficulty increases (Easy: ~87% → Medium: ~43% → Hard: ~15%).
3. **Secondary Method:** `Conv` (purple) shows moderate performance only on the "Easy" task (~33%). Its performance collapses to near zero for "Medium" and "Hard" tasks.
4. **Ineffective Methods:** `Hier`, `Seq`, and `Rand` show solve rates at or near 0% across all three difficulty levels, with error bars indicating minimal to no successful solves.
5. **Variability:** The error bars for `P-Field` are substantial, especially in the "Easy" and "Medium" panels, indicating considerable variability in its performance. The error bars for other methods are small, consistent with their near-zero success rates.
### Interpretation
This chart demonstrates a clear hierarchy of method effectiveness for the given task. `P-Field` is the only method that achieves meaningful solve rates, though its efficacy is highly sensitive to problem difficulty. The `Conv` method has limited utility, only showing promise on the easiest problems. The remaining methods (`Hier`, `Seq`, `Rand`) appear to be ineffective baselines or failed approaches for this specific challenge.
The data suggests that the problem space has a structure that `P-Field` is uniquely able to exploit, but this advantage erodes as complexity increases. The near-zero performance of `Rand` (presumably a random baseline) confirms that solving the task requires more than chance. The stark drop-off for all methods from "Easy" to "Medium" indicates a significant step-change in problem complexity between these levels. The consistent, low variability (small error bars) for the non-`P-Field` methods at the bottom of the chart reinforces the conclusion that they are not just occasionally failing, but are fundamentally unsuited to the task.