## Bar Charts: Solve Rate by Problem Difficulty and Category
### Overview
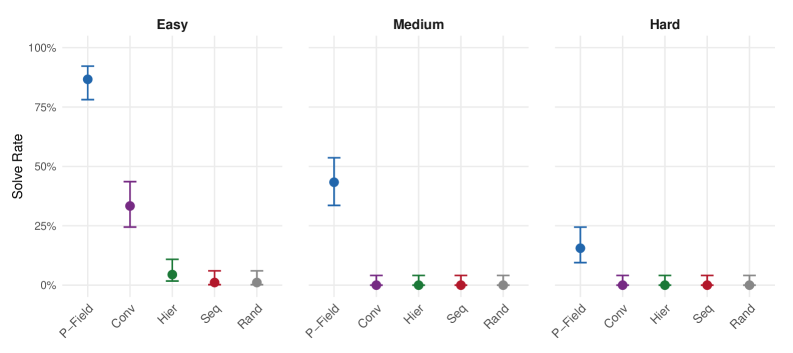
The image contains three side-by-side bar charts comparing solve rates across five problem categories (P-Field, Conv, Hier, Seq, Rand) under three difficulty levels (Easy, Medium, Hard). Each chart uses colored data points with error bars to represent mean solve rates and their variability.
### Components/Axes
- **X-Axes**: Labeled with problem categories:
`P-Field` (blue), `Conv` (purple), `Hier` (green), `Seq` (red), `Rand` (gray)
- **Y-Axes**: Labeled "Solve Rate" with a percentage scale (0% to 100%)
- **Legends**: Positioned on the right, mapping colors to categories:
- Blue = P-Field
- Purple = Conv
- Green = Hier
- Red = Seq
- Gray = Rand
- **Error Bars**: Vertical lines with caps indicating 95% confidence intervals
### Detailed Analysis
#### Easy Difficulty
- **P-Field**: ~85% (75%-90%)
- **Conv**: ~35% (25%-45%)
- **Hier**: ~5% (3%-7%)
- **Seq**: ~2% (1%-3%)
- **Rand**: ~1% (0.5%-1.5%)
#### Medium Difficulty
- **P-Field**: ~45% (35%-55%)
- **Conv**: ~2% (1%-3%)
- **Hier**: ~1% (0.5%-1.5%)
- **Seq**: ~1% (0.5%-1.5%)
- **Rand**: ~0.5% (0.2%-0.8%)
#### Hard Difficulty
- **P-Field**: ~15% (10%-20%)
- **Conv**: ~1% (0.5%-1.5%)
- **Hier**: ~0.5% (0.2%-0.8%)
- **Seq**: ~0.5% (0.2%-0.8%)
- **Rand**: ~0.2% (0.1%-0.3%)
### Key Observations
1. **P-Field Dominance**: Consistently highest solve rates across all difficulty levels (~85% in Easy, ~45% in Medium, ~15% in Hard).
2. **Category Hierarchy**: Solve rates decrease in the order: `P-Field > Conv > Hier ≈ Seq > Rand`.
3. **Difficulty Impact**: Solve rates decline sharply with increasing difficulty (e.g., P-Field drops from 85% to 15% as difficulty increases).
4. **Error Bar Patterns**: Larger error bars for higher solve rates (e.g., P-Field in Easy) suggest greater variability in responses for easier problems.
### Interpretation
The data demonstrates that problem difficulty strongly correlates with solve rates, with P-Field problems being the most solvable across all levels. The consistent ranking of categories (`P-Field > Conv > Hier ≈ Seq > Rand`) suggests inherent differences in problem structure or cognitive demands. For example:
- **P-Field**: Likely involves routine or formulaic tasks (e.g., arithmetic).
- **Conv**: Requires basic reasoning (e.g., pattern recognition).
- **Hier/Seq/Rand**: Involve complex reasoning or randomness, making them least solvable.
The error bars indicate that variability in responses is highest for easier problems (e.g., P-Field in Easy), possibly due to overconfidence or inconsistent interpretations. Harder problems show tighter confidence intervals, reflecting more uniform (but low) performance.
This pattern aligns with cognitive load theory, where simpler tasks are more accessible but may involve greater individual differences in execution, while complex tasks uniformly challenge most participants.