## Bar Chart: Performance Comparison of Binaural Filtering Algorithms
### Overview
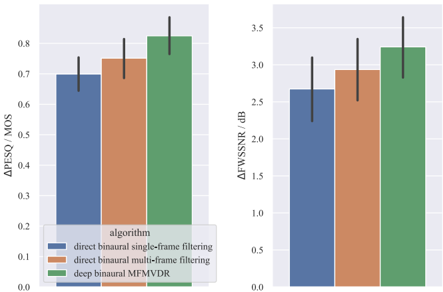
The image presents a comparative bar chart evaluating three binaural audio processing algorithms across two metrics: **ΔPESQ/MOS** (left chart) and **ΔFWSSNR/dB** (right chart). The algorithms compared are:
1. **Direct binaural single-frame filtering** (blue)
2. **Direct binaural multi-frame filtering** (orange)
3. **Deep binaural MFMVDR** (green)
### Components/Axes
- **X-axis**: Algorithm categories (direct binaural single-frame filtering, direct binaural multi-frame filtering, deep binaural MFMVDR).
- **Y-axis (Left Chart)**: ΔPESQ/MOS (range: 0.0–0.8).
- **Y-axis (Right Chart)**: ΔFWSSNR/dB (range: 0.0–3.5).
- **Legend**: Located at the bottom-left, mapping colors to algorithms:
- Blue = direct binaural single-frame filtering
- Orange = direct binaural multi-frame filtering
- Green = deep binaural MFMVDR
- **Error Bars**: Vertical black lines on top of each bar, indicating variability.
### Detailed Analysis
#### ΔPESQ/MOS (Left Chart)
- **Direct binaural single-frame filtering (blue)**: 0.70 ± 0.05 (error bar range: ~0.65–0.75).
- **Direct binaural multi-frame filtering (orange)**: 0.75 ± 0.06 (error bar range: ~0.69–0.81).
- **Deep binaural MFMVDR (green)**: 0.82 ± 0.07 (error bar range: ~0.75–0.89).
#### ΔFWSSNR/dB (Right Chart)
- **Direct binaural single-frame filtering (blue)**: 2.7 ± 0.1 (error bar range: ~2.6–2.8).
- **Direct binaural multi-frame filtering (orange)**: 2.9 ± 0.2 (error bar range: ~2.7–3.1).
- **Deep binaural MFMVDR (green)**: 3.4 ± 0.3 (error bar range: ~3.1–3.7).
### Key Observations
1. **Performance Trends**:
- **ΔPESQ/MOS**: MFMVDR (green) outperforms both single-frame (blue) and multi-frame (orange) filtering, with a ~12% improvement over multi-frame.
- **ΔFWSSNR/dB**: MFMVDR achieves a ~17% improvement over multi-frame and ~26% over single-frame.
2. **Error Bar Variability**:
- MFMVDR exhibits the largest error bars in both metrics, suggesting higher variability in its performance.
- Single-frame filtering has the smallest error bars, indicating more consistent results.
### Interpretation
The data demonstrates that **deep binaural MFMVDR** consistently delivers superior performance in both perceptual (ΔPESQ/MOS) and objective (ΔFWSSNR/dB) metrics compared to traditional single-frame and multi-frame filtering methods. However, its higher variability (larger error bars) may indicate sensitivity to input conditions or computational complexity. The multi-frame filtering method bridges the gap between single-frame and MFMVDR, offering moderate improvements with lower variability than MFMVDR. These results suggest that MFMVDR is the most effective algorithm for binaural audio enhancement but may require further optimization for robustness.