## Scatter Plot: Data Distribution in Two Dimensions
### Overview
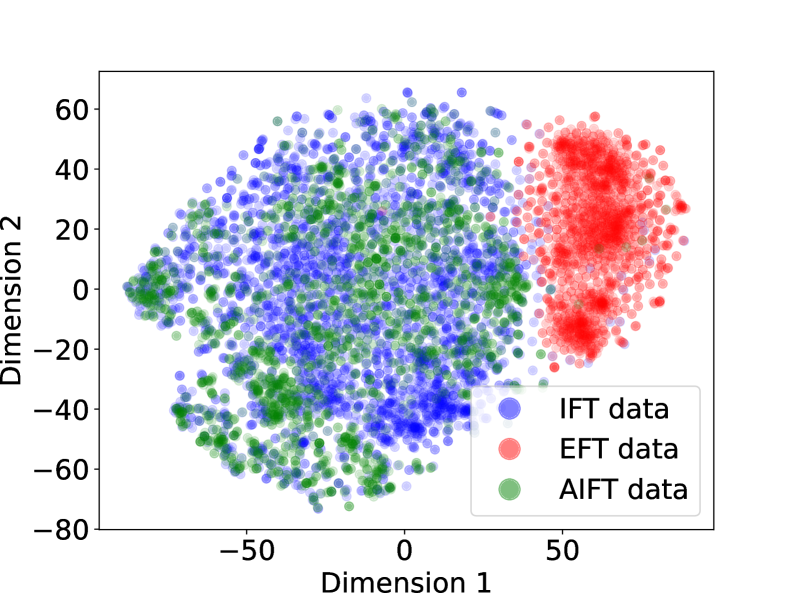
The image is a scatter plot visualizing the distribution of three datasets (IFT, EFT, and AIFT data) across two dimensions. Each data point is represented by a circle, with different colors indicating the dataset it belongs to. The plot shows the clustering and overlap of these datasets in the 2D space.
### Components/Axes
* **X-axis (Dimension 1):** Ranges from approximately -75 to 75, with tick marks at -50, 0, and 50.
* **Y-axis (Dimension 2):** Ranges from approximately -80 to 60, with tick marks at -60, -40, -20, 0, 20, 40, and 60.
* **Legend (Bottom-Right):**
* Blue circle: IFT data
* Red circle: EFT data
* Green circle: AIFT data
### Detailed Analysis
* **IFT Data (Blue):** The blue data points are concentrated in the left side of the plot, spanning from approximately -75 to 25 on the x-axis and -75 to 60 on the y-axis. The distribution appears to be somewhat clustered, with a higher density of points in the upper-left quadrant.
* **EFT Data (Red):** The red data points are clustered on the right side of the plot, primarily between x = 25 and x = 75, and y = -20 and y = 60. This cluster is relatively dense and distinct from the other two datasets.
* **AIFT Data (Green):** The green data points are distributed more broadly, overlapping with the blue data on the left side of the plot. They span from approximately -75 to 25 on the x-axis and -60 to 60 on the y-axis. There is significant overlap between the green and blue data points.
### Key Observations
* The EFT data forms a distinct cluster on the right side of the plot.
* The IFT and AIFT data overlap significantly on the left side of the plot.
* There is some overlap between all three datasets in the central region of the plot.
### Interpretation
The scatter plot suggests that the EFT data is well-separated from the IFT and AIFT data in this two-dimensional space. The IFT and AIFT data, however, are more closely related, as indicated by their overlapping distributions. This visualization could represent a dimensionality reduction technique applied to the original data, where the two dimensions capture the most significant variance. The clustering and separation of the datasets suggest that these features could be used to distinguish between the different data types. The overlap between IFT and AIFT data may indicate similarities or shared characteristics between these two datasets.