# Technical Document Extraction: 2D Dimensionality Reduction Plot
## 1. Component Isolation
* **Header:** None.
* **Main Chart Area:** A scatter plot containing thousands of semi-transparent data points distributed across two dimensions.
* **Axes:** Labeled X and Y axes with numerical scales.
* **Legend:** Located in the bottom-right quadrant of the chart area.
## 2. Axis Information
* **X-Axis Label:** `Dimension 1`
* **X-Axis Scale:** Ranges from approximately -100 to +100. Major tick marks are labeled at `-50`, `0`, and `50`.
* **Y-Axis Label:** `Dimension 2`
* **Y-Axis Scale:** Ranges from -80 to +80. Major tick marks are labeled at `-80`, `-60`, `-40`, `-20`, `0`, `20`, `40`, and `60`.
## 3. Legend and Data Series Identification
The legend is positioned at approximately `[x=75, y=-50]` relative to the chart coordinates. It identifies three distinct data categories:
| Category Label | Color | Visual Trend / Spatial Distribution |
| :--- | :--- | :--- |
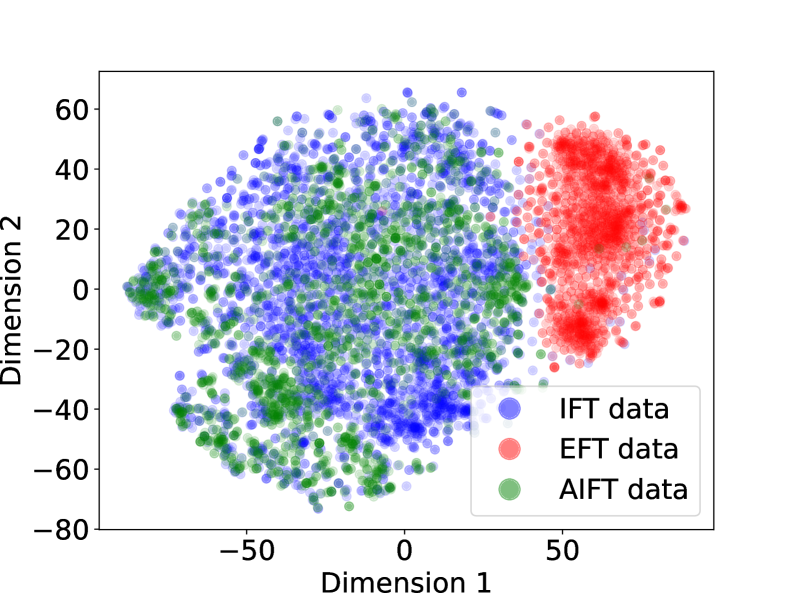
| **IFT data** | Blue | Broadly distributed across the center and left. High density between `Dimension 1` [-75, 25] and `Dimension 2` [-60, 60]. |
| **EFT data** | Red | Highly clustered on the right side. Concentrated between `Dimension 1` [40, 80] and `Dimension 2` [-25, 55]. |
| **AIFT data** | Green | Intermingled primarily with the blue "IFT data" on the left and center. Distributed between `Dimension 1` [-80, 30] and `Dimension 2` [-75, 60]. |
## 4. Data Analysis and Spatial Grounding
The image represents a dimensionality reduction visualization (likely t-SNE or UMAP) showing the relationship between three datasets.
* **Cluster 1 (Mixed):** Comprised of **IFT data (Blue)** and **AIFT data (Green)**. These two series show significant spatial overlap, suggesting high similarity in their underlying features. They occupy the coordinate space from roughly `x = -85` to `x = 35`.
* **Cluster 2 (Distinct):** Comprised of **EFT data (Red)**. This series forms a distinct, vertically elongated cluster on the right side of the plot, starting around `x = 40`. There is very little overlap between the Red points and the Blue/Green points, indicating that EFT data is statistically distinct from IFT and AIFT data in this feature space.
* **Density:** The "EFT data" (Red) appears to have higher local density (more opaque areas) compared to the more diffused "IFT" and "AIFT" data.
## 5. Precise Text Transcription
* **Y-Axis:** `Dimension 2`
* **X-Axis:** `Dimension 1`
* **Legend Item 1:** `IFT data`
* **Legend Item 2:** `EFT data`
* **Legend Item 3:** `AIFT data`
* **Numerical Markers:** `-80`, `-60`, `-40`, `-20`, `0`, `20`, `40`, `60`, `-50`, `0`, `50`