\n
## Scatter Plot: Dimensionality Reduction of Data
### Overview
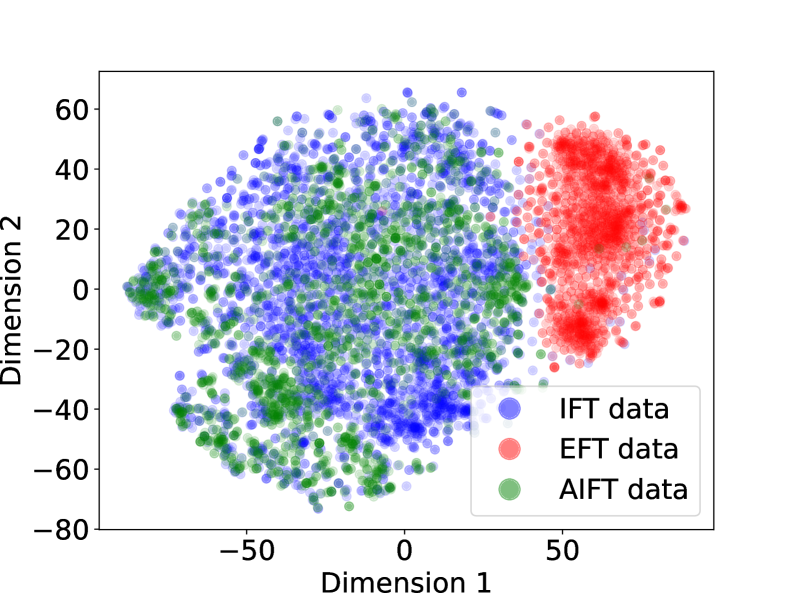
This image presents a scatter plot visualizing the results of a dimensionality reduction technique (likely t-SNE or UMAP) applied to four different datasets: IFT, EFT, AIFT, and a combined dataset. The plot displays the data points projected onto two dimensions, Dimension 1 and Dimension 2, allowing for visual assessment of data separation and clustering.
### Components/Axes
* **X-axis:** Dimension 1, ranging approximately from -70 to 60.
* **Y-axis:** Dimension 2, ranging approximately from -80 to 60.
* **Legend (top-right):**
* Blue circles: IFT data
* Red circles: EFT data
* Green circles: AIFT data
* Light Blue circles: Combined IFT data
### Detailed Analysis
The plot shows a clear separation between the EFT data (red) and the other three datasets. The IFT data (blue) and AIFT data (green) are more intermixed, with some degree of overlap. The combined IFT data (light blue) appears to be distributed similarly to the IFT data (blue), but with a slightly wider spread.
* **EFT Data (Red):** This data forms a distinct cluster in the top-right quadrant of the plot, centered around Dimension 1 ≈ 40 and Dimension 2 ≈ 10. The points are relatively tightly grouped, indicating high similarity within this dataset.
* **IFT Data (Blue):** This data occupies a large portion of the left side of the plot, spanning from Dimension 1 ≈ -60 to Dimension 1 ≈ 10. The distribution is more dispersed than the EFT data, with points scattered across a wider range of Dimension 2 values (approximately -60 to 50).
* **AIFT Data (Green):** This data is primarily located in the lower-left quadrant, with a concentration around Dimension 1 ≈ -30 and Dimension 2 ≈ -40. It exhibits some overlap with the IFT data, particularly in the central region of the plot.
* **Combined IFT Data (Light Blue):** This data is distributed similarly to the IFT data (blue), but with a slightly wider spread.
### Key Observations
* The EFT data is clearly distinguishable from the other datasets.
* The IFT and AIFT data exhibit significant overlap, suggesting some similarity between these datasets.
* The combined IFT data does not significantly alter the distribution of the IFT data.
* There is a noticeable gap between the EFT cluster and the IFT/AIFT clusters.
### Interpretation
The scatter plot suggests that the EFT data possesses unique characteristics that differentiate it from the IFT and AIFT datasets. The dimensionality reduction technique has successfully separated these datasets based on their underlying features. The overlap between IFT and AIFT data indicates that these datasets share some common characteristics, while the distinct EFT cluster suggests that this dataset is fundamentally different. The clear separation between the clusters implies that the chosen dimensions (Dimension 1 and Dimension 2) effectively capture the key variations within the data. The fact that the combined IFT data does not drastically change the IFT data distribution suggests that the combination process did not introduce significant new information or alter the underlying structure of the IFT data. This visualization could be used to inform further analysis, such as identifying the features that contribute to the separation between the datasets or exploring the relationships between the IFT and AIFT data.