# Technical Document Extraction: Scatter Plot Analysis
## Chart Description
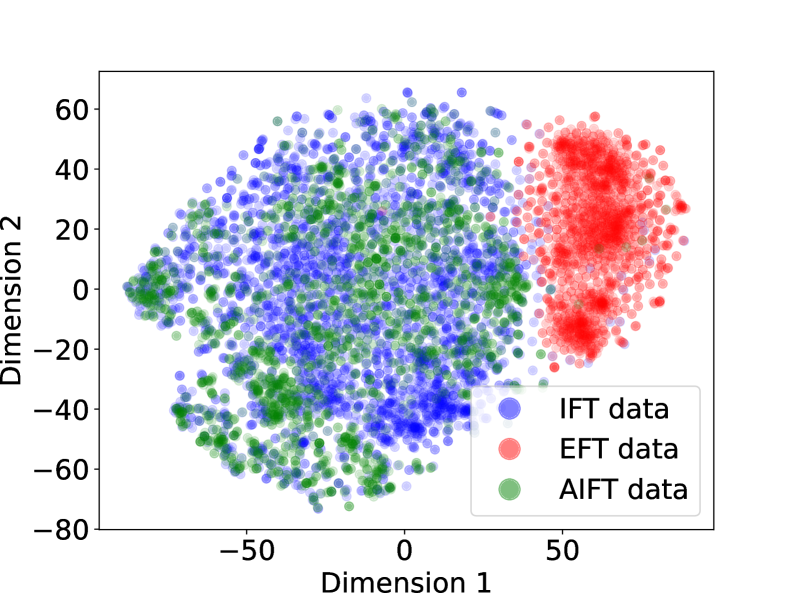
This image depicts a 2D scatter plot visualizing three distinct datasets in a dimensional space. The plot uses color-coded points to differentiate data categories, with axes labeled as "Dimension 1" (horizontal) and "Dimension 2" (vertical).
---
## Key Components
### Axes
- **X-axis (Dimension 1):** Ranges from -50 to 50
- **Y-axis (Dimension 2):** Ranges from -80 to 60
### Legend
| Color | Dataset |
|--------|----------|
| Blue | IFT data |
| Red | EFT data |
| Green | AIFT data|
---
## Data Distribution
1. **EFT Data (Red Points):**
- Clustered in the upper-right quadrant
- Concentrated between Dimension 1: 30–50 and Dimension 2: 20–60
- High density with minimal dispersion
2. **AIFT Data (Green Points):**
- Distributed across the central region
- Spans Dimension 1: -30 to 30 and Dimension 2: -40 to 40
- Overlaps with IFT data in the central quadrant
3. **IFT Data (Blue Points):**
- Widely dispersed across the plot
- Primary concentration in Dimension 1: -50 to 0 and Dimension 2: -80 to 0
- Secondary cluster overlaps with AIFT data in the central region
---
## Observations
- **Dimensional Separation:** EFT data exhibits clear separation from IFT and AIFT datasets in the upper-right quadrant.
- **Overlap Regions:** AIFT and IFT data share significant overlap in the central quadrant (Dimension 1: -20 to 20, Dimension 2: -20 to 20).
- **Dimensional Range:** All datasets occupy the full range of Dimension 2 (-80 to 60), but EFT data is restricted to the upper half of Dimension 2.
---
## Technical Notes
- No explicit numerical data table is present; values are inferred from point distributions.
- No textual annotations or embedded labels beyond the legend and axis titles.
- Color consistency verified: Legend colors match point colors in the plot.