## Line Chart: L0 over Training Steps
### Overview
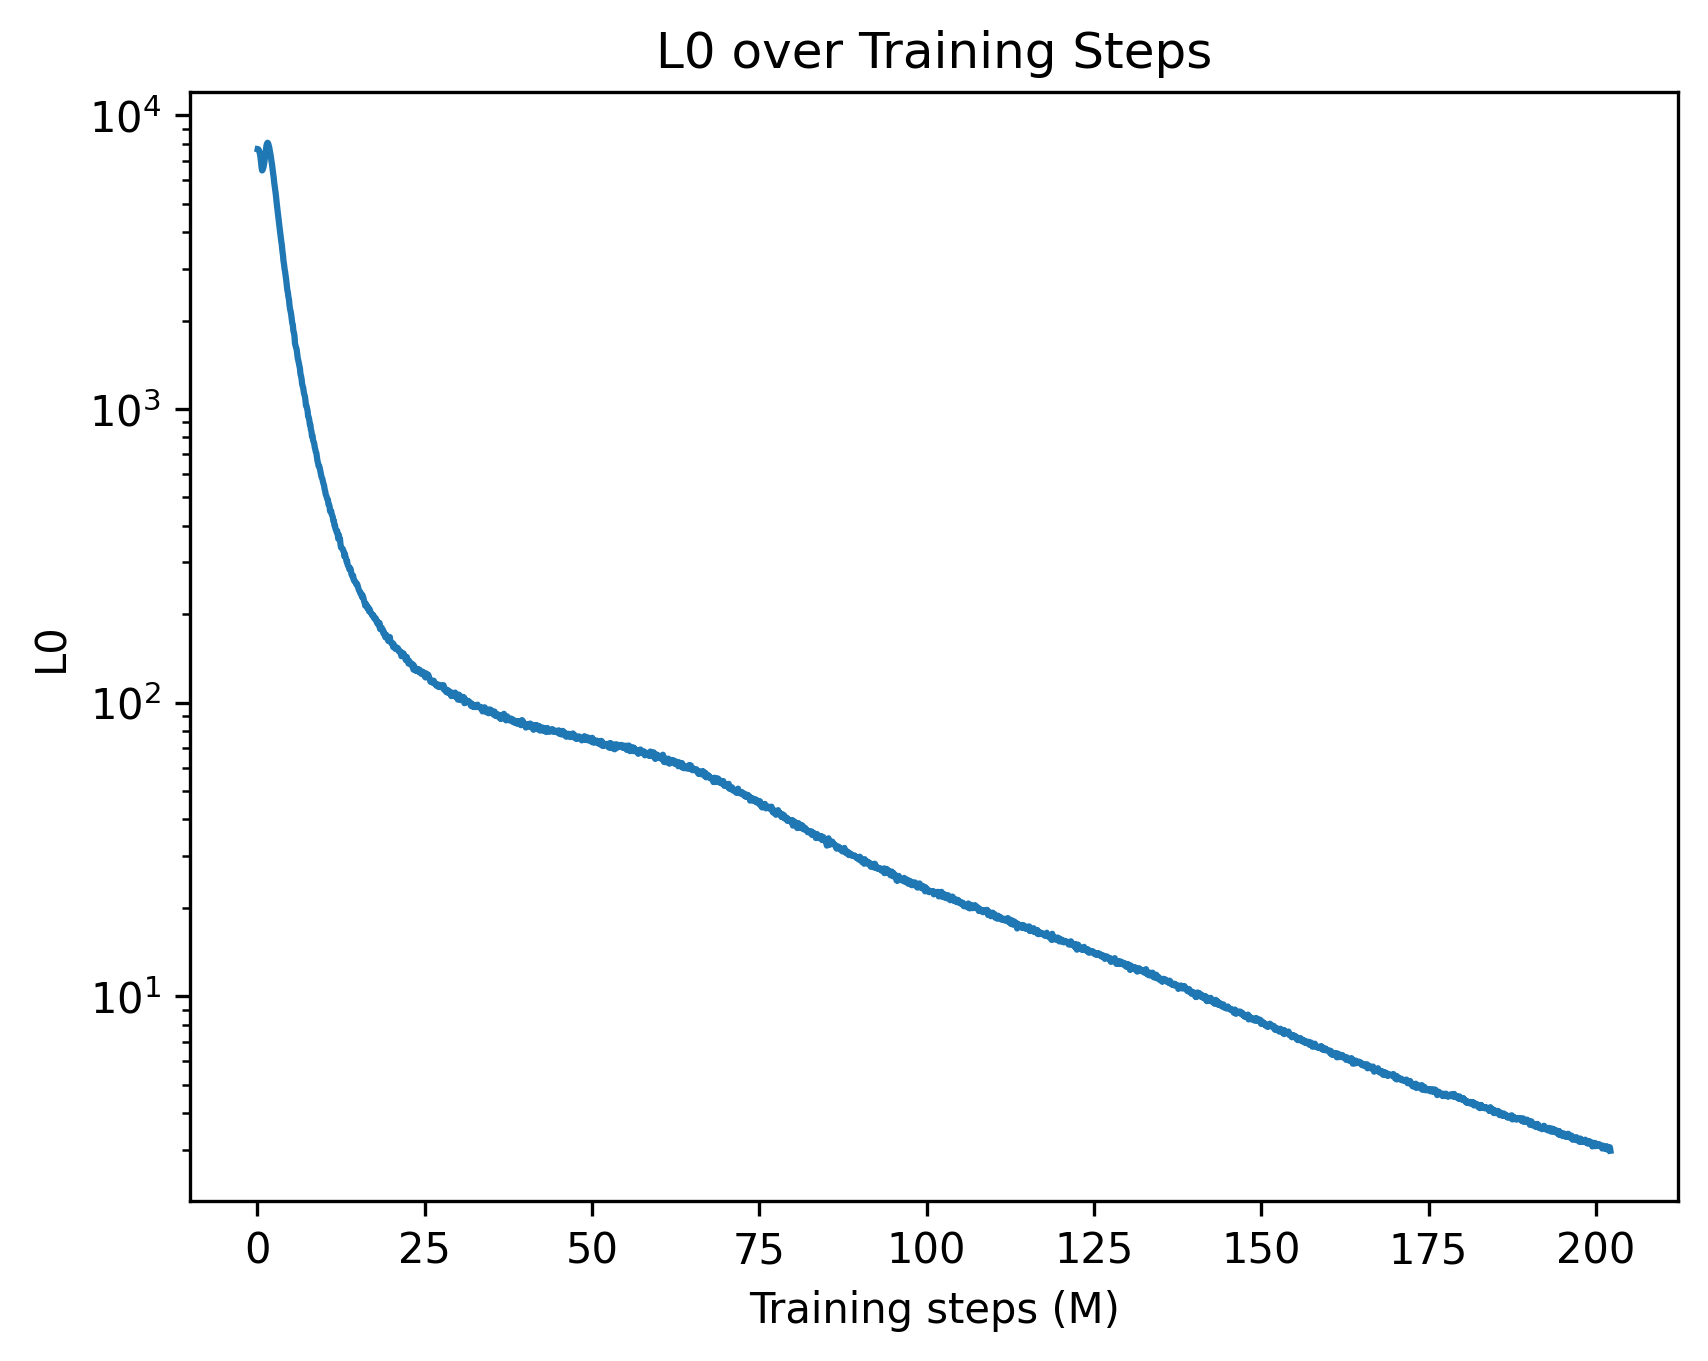
The chart depicts the logarithmic scale of loss (L0) decreasing over training steps (measured in millions). The y-axis uses a logarithmic scale (10¹ to 10⁴), while the x-axis spans 0 to 200 million training steps. A single blue line represents the loss trajectory, showing a steep initial decline followed by a gradual, near-linear decrease.
### Components/Axes
- **Title**: "L0 over Training Steps" (centered at the top).
- **X-axis**: "Training steps (M)" with markers at 0, 25, 50, 75, 100, 125, 150, 175, and 200 million steps.
- **Y-axis**: "L0" with logarithmic markers at 10¹, 10², 10³, and 10⁴.
- **Legend**: Located in the top-left corner, labeling the blue line as "L0."
- **Line**: A single blue line (solid, no markers) representing loss values.
### Detailed Analysis
- **Initial Drop**: At 0 training steps, L0 starts near 10⁴. By 25 million steps, it drops to ~10³.
- **Mid-Training**: Between 50 and 100 million steps, L0 decreases from ~10² to ~10¹.
- **Late Training**: From 100 to 200 million steps, L0 declines from ~10¹ to ~10⁰ (near 1).
- **Trend**: The line is smooth, with no plateaus or spikes. The logarithmic scale emphasizes exponential decay in early training, transitioning to a near-linear decline later.
### Key Observations
1. **Rapid Initial Improvement**: Loss decreases by ~90% (from 10⁴ to 10³) in the first 25 million steps.
2. **Gradual Convergence**: After 50 million steps, the rate of loss reduction slows, suggesting diminishing returns.
3. **Final Value**: At 200 million steps, L0 approaches ~1, indicating near-optimal performance.
### Interpretation
The chart demonstrates typical machine learning convergence behavior. The steep early decline reflects the model learning basic patterns, while the later gradual decrease suggests fine-tuning of complex relationships. The logarithmic scale highlights the efficiency of early training phases. No anomalies are observed, implying stable training dynamics. This data could inform decisions about training duration or resource allocation for similar models.