# Technical Document Extraction: RMSE vs. Number of Parameters
## Chart Structure
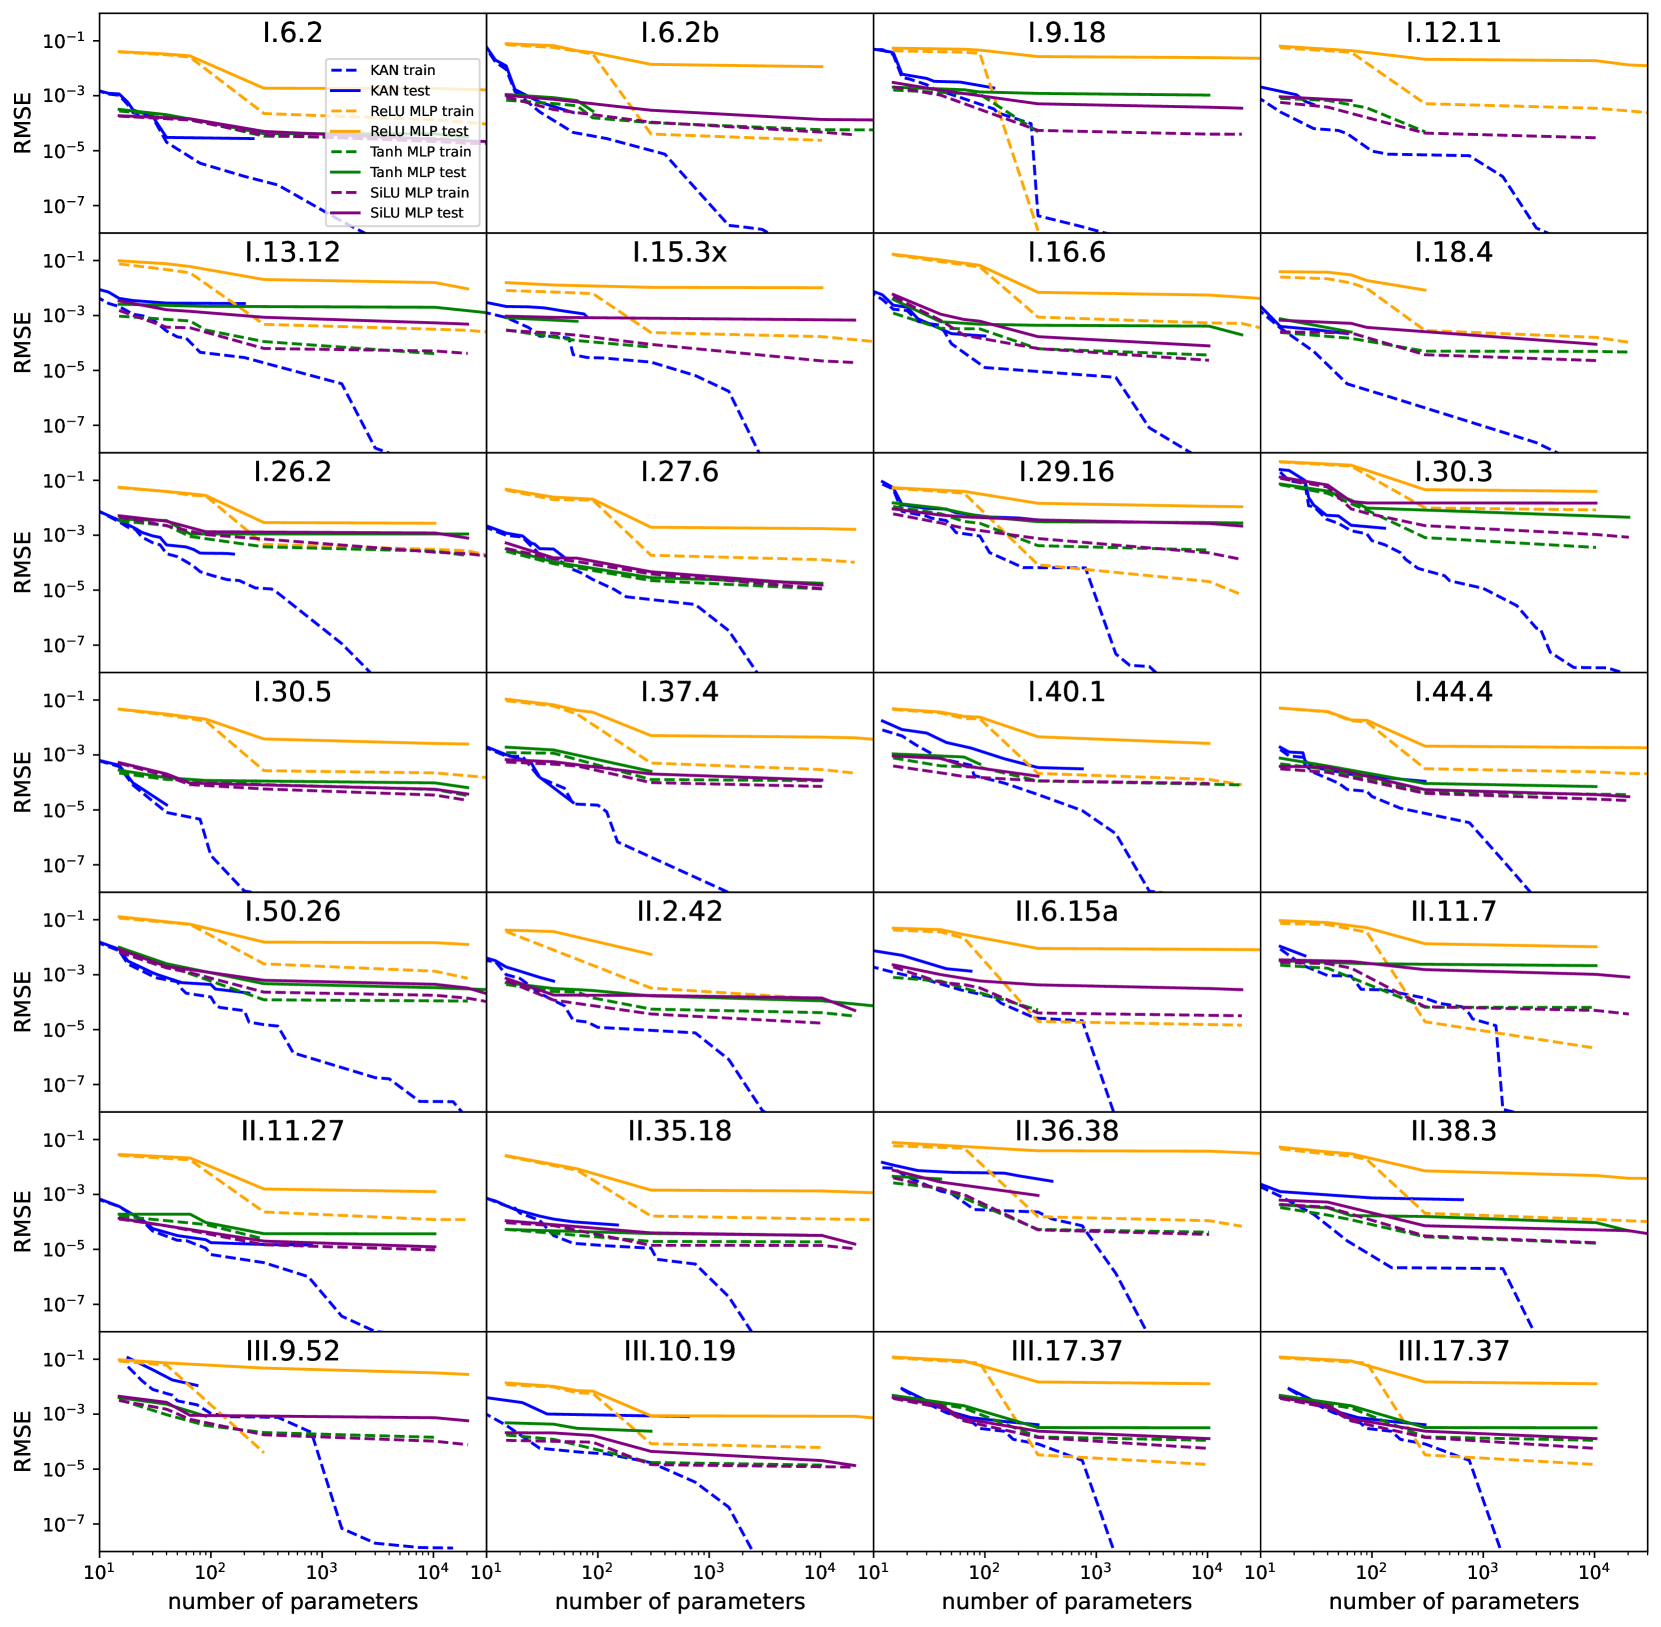
- **Grid Layout**: 4 columns × 7 rows of subplots (28 total charts).
- **X-Axis**: "number of parameters" (log scale: 10¹ to 10⁴).
- **Y-Axis**: "RMSE" (log scale: 10⁻¹ to 10⁻⁷).
## Legend (Consistent Across All Charts)
| Model/Type | Color | Line Style |
|---------------------|--------|------------|
| KAN train | Blue | Solid |
| KAN test | Blue | Dashed |
| ReLU MLP train | Orange | Dashed |
| ReLU MLP test | Orange | Solid |
| Tanh MLP train | Green | Solid |
| Tanh MLP test | Green | Dashed |
| SiLU MLP train | Purple | Solid |
| SiLU MLP test | Purple | Dashed |
## Key Trends
1. **KAN Models**:
- **Train/Test Lines**: Solid/Dashed blue lines.
- **Behavior**: Sharp RMSE reduction at low parameter counts (10¹–10³), followed by plateauing. Test RMSE often outperforms training RMSE after parameter scaling.
2. **ReLU MLP**:
- **Train/Test Lines**: Dashed/Solid orange lines.
- **Behavior**: Gradual RMSE decline, plateauing at higher parameter counts. Test RMSE converges closely with training RMSE.
3. **Tanh MLP**:
- **Train/Test Lines**: Solid/Dashed green lines.
- **Behavior**: Similar to ReLU MLP but with slightly higher RMSE values. Test RMSE shows minimal divergence from training RMSE.
4. **SiLU MLP**:
- **Train/Test Lines**: Solid/Purple dashed lines.
- **Behavior**: Smooth RMSE reduction, often outperforming ReLU/Tanh MLPs at mid-to-high parameter counts. Test RMSE closely tracks training RMSE.
## Notable Observations
- **Parameter Efficiency**: KAN models achieve lower RMSE with fewer parameters compared to MLPs.
- **Test vs. Train**: Test RMSE generally improves relative to training RMSE as parameters increase, except for KAN models where test RMSE plateaus earlier.
- **Model Comparison**: SiLU MLP often exhibits the best performance at higher parameter counts, followed by Tanh, ReLU, and KAN.
## Subplot Labels
Each chart is labeled with a unique identifier (e.g., "I.6.2", "II.38.3") at the top, likely representing dataset/configuration variations. No additional textual annotations are present in the charts.